GMS:The GMS Window: Difference between revisions
m (Unjedai moved page GMS:The GMS Screen to GMS:The GMS Window) |
No edit summary |
||
| Line 1: | Line 1: | ||
[[Image:GMS_screen.jpg|thumb|600px]] | [[Image:GMS_screen.jpg|thumb|600px]] | ||
The GMS | The GMS window is divided into seven main sections: | ||
===Menu Bar=== | ===Menu Bar=== | ||
The [[GMS:File Menu|''File'']], [[GMS:Edit Menu|''Edit'']], [[GMS:Display Menu|''Display'']], Window and Help menus are always available. Other menus change based on the [[GMS:What_Is_GMS#Modules|module]] or [[GMS:What_Is_GMS#Numerical Models|numerical model]] in use. | |||
=== | ===XYZF Bar=== | ||
These fields are used to edit the coordinates of selected items (vertices, nodes, scatter points, etc.) | These fields are used to edit the coordinates and scalar data set values of selected items (vertices, nodes, scatter points, etc.). | ||
[[Image:editwind.jpg]] | [[Image:editwind.jpg]] | ||
=== | ===Shortcut Toolbars=== | ||
The [[GMS:Tool Palettes|shortcut toolbars]] are shortcuts to often used menu commands. | |||
===Graphics Window=== | ===Graphics Window=== | ||
The | The ''Graphics Window'' is where data is rendered and the user interacts with the data using tools. | ||
[[Image:graphics_window.jpg|rhumb|none|left|600px]] | [[Image:graphics_window.jpg|rhumb|none|left|600px]] | ||
====Mouse Tracking Bar==== | |||
This shows the real world coordinates of the mouse in the Graphics Window. If the mouse is over a cell, triangle or element, the F value is the dataset scalar value and the ID is the object's number. For 3D Grids, the IJK of the cell is also shown. The progress bar is also found here. | |||
===Project Explorer=== | ===Project Explorer=== | ||
{{only in print| [[Image:Tree_General.jpg|200px|right]]}} | {{only in print| [[Image:Tree_General.jpg|200px|right]]}} | ||
The [[GMS:Project Explorer|''Project Explorer'']] | The [[GMS:Project Explorer|''Project Explorer'']] contains a hierarchical representation of the data associated with a modeling project. | ||
[[Image:Tree_General.jpg|thumb|none|left|200px|Example of the [[GMS:Project Explorer|''Project Explorer'']] ]] | [[Image:Tree_General.jpg|thumb|none|left|200px|Example of the [[GMS:Project Explorer|''Project Explorer'']] ]] | ||
===Status Bar=== | ===Status Bar=== | ||
The ''Status Bar'' is used to display | The ''Status Bar'' is used to display messages and information about selected items. It also shows the display projection. | ||
[[Image:StatusBar.jpg]] | [[Image:StatusBar.jpg]] | ||
Revision as of 20:28, 23 July 2014
The GMS window is divided into seven main sections:
Menu Bar
The File, Edit, Display, Window and Help menus are always available. Other menus change based on the module or numerical model in use.
XYZF Bar
These fields are used to edit the coordinates and scalar data set values of selected items (vertices, nodes, scatter points, etc.).
Shortcut Toolbars
The shortcut toolbars are shortcuts to often used menu commands.
Graphics Window
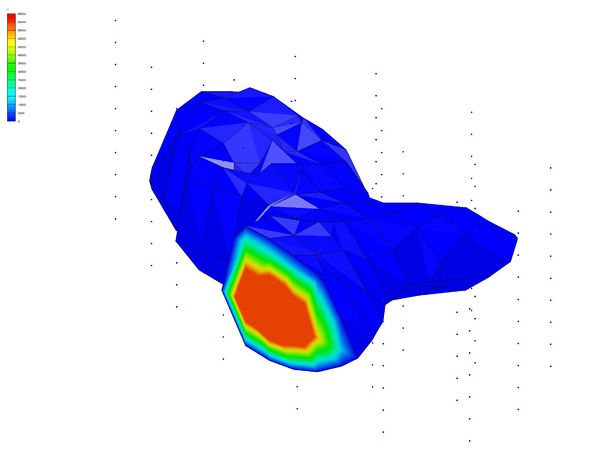
The Graphics Window is where data is rendered and the user interacts with the data using tools.
Mouse Tracking Bar
This shows the real world coordinates of the mouse in the Graphics Window. If the mouse is over a cell, triangle or element, the F value is the dataset scalar value and the ID is the object's number. For 3D Grids, the IJK of the cell is also shown. The progress bar is also found here.
Project Explorer
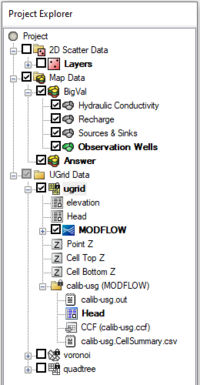
The Project Explorer contains a hierarchical representation of the data associated with a modeling project.

Status Bar
The Status Bar is used to display messages and information about selected items. It also shows the display projection.
GMS – Groundwater Modeling System | ||
|---|---|---|
| Modules: | 2D Grid • 2D Mesh • 2D Scatter Point • 3D Grid • 3D Mesh • 3D Scatter Point • Boreholes • GIS • Map • Solid • TINs • UGrids | |
| Models: | FEFLOW • FEMWATER • HydroGeoSphere • MODAEM • MODFLOW • MODPATH • mod-PATH3DU • MT3DMS • MT3D-USGS • PEST • PHT3D • RT3D • SEAM3D • SEAWAT • SEEP2D • T-PROGS • ZONEBUDGET | |
| Aquaveo | ||
