AHGW:Time Series Grapher Setup
Examples
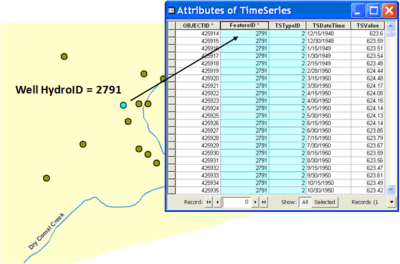
Analysis of time series data (e.g. water quality, water levels, discharge, etc.) is an important part of hydrologic analysis. Arc Hydro provides a design for storing time series data as tabular information related to spatial features (e.g. wells, gages). The Arc Hydro design relates time series values with spatial features through the HydroID-FeatureID relationship. Every time series value is indexed by a Date/time and by a location through a FeatureID that relates to a spatial feature. For example, water levels recorded in a specific well are indexed with the HydroID of the well.
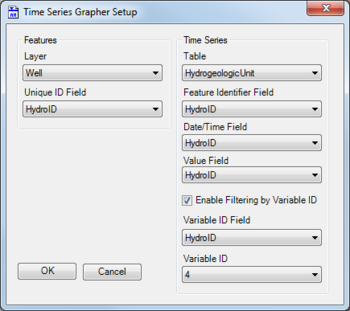
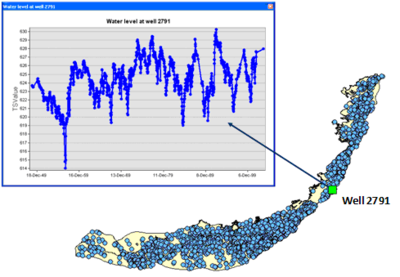
The Time Series Grapher tool automates the creation of time series plots (e.g. groundwater levels, concentrations). The tool is an interactive tool that allows users to click on features and plot related time series data. The user first sets up the tool by specifying certain options.
Once the setup is complete the user can click on features in the map to create the plot of associated time series.


