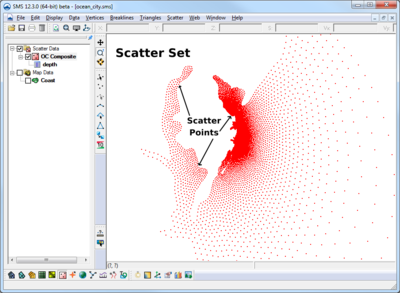
SMS:Scatter Module
At a glance
- Used to create, edit, and visualize triangulated irregular networks
- DEMs can be read in and converted to TINs
- Filter scatter sets to eliminate redundant data
- Datasets can be interpolated to other modules (meshes, grids, etc)
Overview
The Scatter Module (previously known as the Scattered Data Module) is used to interpolate spatial data values from groups of scattered data points or ordered grids (DEMs) to the other data types (i.e., meshes and grids). SMS supports three interpolation schemes including linear, natural neighbor and inverse distance weighted. The module is also used to view and edit survey data (i.e. SHOALS data).
Interpolation is useful for setting up input data for analysis codes. Generally, the data gathered from a site to be modeled varies in density. Generating a finite element mesh directly from these points would result in a very low quality mesh. Further this data does not lie in a grid for use as a finite difference grid. Interpolation allows the gathered data points to be used as background information. The user may then generate a base mesh or grid in the Mesh Module, the Grid Module or the Map Module. The only consideration of bathymetry for such a mesh or grid would be the definition of element edges along geometric or property features. The actual bathymetry comes from the scattered data. SMS interpolates this data to the created mesh or grid points.
Interpolation may also be used to create datasets for one mesh from data related to another mesh of the same region. For example, a user may have a mesh of a river reach for which analysis has been preformed. If a bridge is to be added to the reach, the mesh topology changes. The data from the first mesh can be converted to a scattered dataset and then interpolated to the second mesh. This data may be used as initial conditions for the second mesh, or compared to results of analysis run on the second mesh using the Dataset Toolbox.
A third purpose of interpolation is to create additional datasets from either observed, or calculated data.
Data Sources
There are various potential sources for background data in an SMS project. These include:
In addition, when DEM data is brought into SMS, the data is triangulated and stored as a scatter set.
It is also possible to convert CAD and GIS data into scatter sets. This is accomplished by right clicking on the object in the project explorer and selecting the "Map → Scatter" command. This command searches the data for triangular and quadrilateral faces and converts them to triangles in a triangulated surface (TIN). Points along contours or polylines are not converted using this command. In order to use these points in a scattered data set format, first convert them to feature objects in the Map module.
Data Mapping
Practical Notes
Does SMS have a way of measuring the difference in volume between two bathymetric surveys?
To do this you need to do the following:
- Interpolate the elevation from one survey onto the other.
- Use the data calculator to compute the difference between the two elevations. You may want to do max(0.0, z1-z2) as well as max(0.0, z2-z1) to get both deposition and erosion volume.
- Turn on the "Volume" option in the info options dialog.
- Select the triangles you are interested in. The volume appears in the info window at the bottom of the screen. You can also direct these values to a file or another window through the Info Options settings.
How do I compare data sets from different scatter point sets?
Datasets within a scatter set are associated with the geometry of that scatter set. To compare datasets from different scatter sets, it is necessary to first interpolate the data sets to a common geometry. Below are guidelines on how to do this with a mesh and with a scatter grid.
- Mesh
- Interpolate the first dataset to mesh.
- Interpolate the second dataset to the mesh.
- Use the data calculator (Data | Data Calculator) to compare the two datasets.
- Scatter Grid
- Select first dataset.
- Select “Scatter | Interpolate to Scatter | …to Scatter Grid”. Specify extents and resolution of grid.
- Select second dataset.
- Select “Scatter | Interpolate to Scatter | …from other scatter set”. Specify the second scatter set.
- Select “Data | Data Calculator” with the new scatter grid selected to compare the two datasets.
Scatter Module Tools
See Scatter Module Tools for more information.
Scatter Module Menus
See Scatter Module Menus for more information.
Related Topics
- Digital Elevation Maps
- Mesh Generation
- Scatter Interpolation
- Scatter Module Display Options
- Scatter Sets
External Links
- Jun 2002 ERDC/CHL CHETN-IV-43 SHOALS Toolbox: Software to Support Visualization and Analysis of Large, High-Density Data Sets [1]
| [hide] SMS – Surface-water Modeling System | ||
|---|---|---|
| Modules: | 1D Grid • Cartesian Grid • Curvilinear Grid • GIS • Map • Mesh • Particle • Quadtree • Raster • Scatter • UGrid |  |
| General Models: | 3D Structure • FVCOM • Generic • PTM | |
| Coastal Models: | ADCIRC • BOUSS-2D • CGWAVE • CMS-Flow • CMS-Wave • GenCade • STWAVE • WAM | |
| Riverine/Estuarine Models: | AdH • HEC-RAS • HYDRO AS-2D • RMA2 • RMA4 • SRH-2D • TUFLOW • TUFLOW FV | |
| Aquaveo • SMS Tutorials • SMS Workflows | ||
