AHGW:Make Time Series Statistics
The Make Time Series Statistics dialog is accessed by double-clicking on "![]() Make Time Series Statistics" under the "
Make Time Series Statistics" under the "![]() Groundwater Analyst" toolset under the "
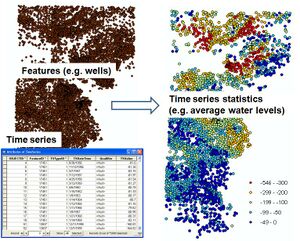
Groundwater Analyst" toolset under the "![]() Arc Hydro Groundwater Tools" toolbox. This tool creates mappable layers of time series by joining spatial features (points, lines, polygons) with time series data (e.g., water levels, concentrations). The output is a new feature class containing features with summary statistics (e.g., mean, max, min) of the related time series over a given time period.
Arc Hydro Groundwater Tools" toolbox. This tool creates mappable layers of time series by joining spatial features (points, lines, polygons) with time series data (e.g., water levels, concentrations). The output is a new feature class containing features with summary statistics (e.g., mean, max, min) of the related time series over a given time period.
The following fields are available. Required fields are marked with a ![]() icon. Fields marked with a
icon. Fields marked with a ![]() icon may either not be supported or the table doesn't exist.
icon may either not be supported or the table doesn't exist.
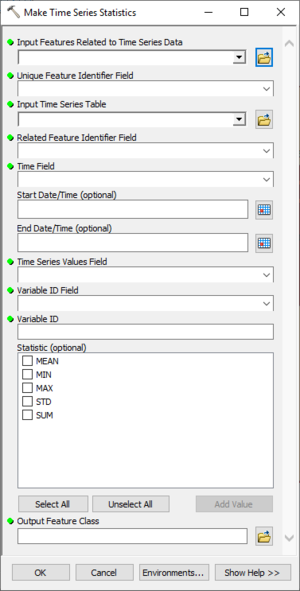
 Input Features Related to Time Series Data – Click the
  button to bring up the Input Features Related to Time Series Data dialog in order to specify the feature layer containing the features associated with time series to be mapped.
 Unique Feature Identifier Field – Select from the drop-down the field in the Input Feature Layer containing a unique identifier of the features. Data in the time series table should be associated to the spatial features through this key field.
 Input Time Series Table –Click the
  button to bring up the Input Time Series Table dialog in order to specify the table containing the time series data.
 Related Feature Identifier Field – Select from the drop-down the field in the Time Series table that contains identifiers associating time series values with spatial features in the geodatabase.
 Time Field – Select the field in the Time Series table containing the date/time of the time series.
- Start Date/Time – Optional. Click the
 button to bring up the Date dialog in order to specify the beginning of the time period for which statistics are calculated.
 - End Date/Time – Optional. Click the
 button to bring up the Date dialog in order to specify the end of the time period for which statistics are calculated.
  Time Series Value Field – Select the field in the Time Series table containing the time series values (the field that stores water level values).
 Variable ID Field – Select the field in the Time Series table defining the type of the time series. This field distinguishes types such as water levels from concentrations.
 Time Field – Enter the value indicating which time series type to include in the analysis.
- Statistic – Optional. Turn on the statistic(s) to be calculated and displayed in the map. Options include: Mean, Min (Minimum), Max (Maximum), STD (standard deviation), and Sum.
- Select All – Select all of the statistics in the list.
- Unselect All – Deselect all of the statistics in the list.
- Add Value –
 Output Feature Class – Click the
  button to bring up the Output Feature Class dialog in order to specify the name and location of the output feature class.
- OK – Saves all changes, closes the Make Time Series Statistics dialog, and runs the tool.
- Cancel – Discards all changes and closes the Make Time Series Statistics dialog.
- Environments... – Brings up the Environment Settings dialog in ArcGIS.
- Show Help – Opens the Help slider on the right side of the dialog.
- Hide Help – Closes the Help slider on the right side of the dialog.
- Tool Help – Only visible if the Help slider is open. Click to open the ArcGIS help for this dialog.
Implementation
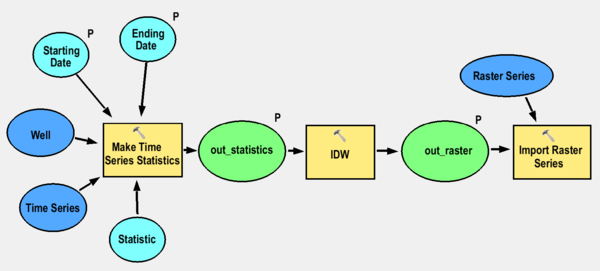
The tool can be linked with interpolation tools and with the Add to Raster Series tool to automate the process of interpolating surfaces for given time periods. For example, the tool can be used to produce monthly/daily water level surfaces.


