AHGW:Borehole Editor Advanced
| This tool was designed specifically for the Southwest Florida Water Management District, and has settings and features specific to them. We cannot guarantee this tool will be useful to anyone outside the SWFWMD. |
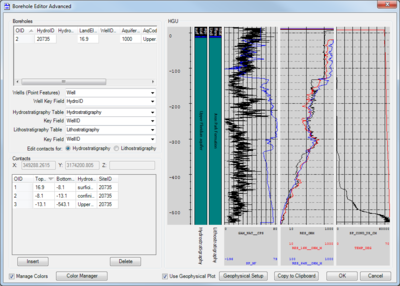
The Borehole Editor Advanced dialog is accessed by selecting Subsurface | Borehole/Well Advanced Editor on the Arc Hydro Groundwater Toolbar. This tool allows advanced editing of boreholes and wells in ArcGIS, and requires special tables to be used.
Borehole Editor Advanced
The following sections, options, and fields are available in this dialog:
- Boreholes section
- At the top of this section is a spreadsheet with the following columns:
- OID – The Object ID from the table.
- HydroID – The HydroID assigned to the well or borehole..
- HydroCode –
- LandElev – The elevation of the top of the borehole.
- WellDepth – The depth of the well.
- AquiferID – The AquiferID assigned to the well or borehole.
- AqCode –
- HGUID – The AquiferID assigned to the well or borehole.
- Ftype – The FType of the well or borehole.
- Wells (Point Features) – A drop-down populated with a list of point feature classes that could represent wells.
- Well Key Field – A drop-down populated by possible unique ID field names from the selected table. Typically, this is the HydroID field.
- Hydrostratigraphy Table – A drop-down populated with a list of possible hydrostratigraphy tables.
- Key Field – A drop-down populated by possible unique ID field names from the selected table. Typically, this is the WellID field.
- Lithostratigraphy Table – A drop-down populated with a list of possible lithostratigraphy tables.
- Key Field – A drop-down populated by possible unique ID field names from the selected table. Typically, this is the WellID field.
- Edit contacts for – Radio button to select contacts to edit.
- At the top of this section is a spreadsheet with the following columns:
- Contacts section –
- X, Y, and Z – Lists the XYZ coordinates of the selected borehole or well. Not editable in this dialog.
- If "Hydrostratigraphy" is selected from the Edit contacts for option, the spreadsheet has the following columns:
- OID – Object ID from the table.
- TopElev – The top elevation of the borehole or well.
- BottomElev – The bottom elevation of the borehole or well.
- Hydrostratigraphy – A brief description of what kind of hydrostratigraphy the OID is.
- SiteID – The SiteID of the OID.
- If "Lithostratigraphy" is selected from the Edit contacts for option, the spreadsheet has the following columns:
- OID – Object ID from the table.
- TopElev – The top elevation of the borehole or well.
- BottomElev – The bottom elevation of the borehole or well.
- Lithostratigraphy – A brief description of what kind of hydrostratigraphy the OID is.
- SiteID – The SiteID of the OID.
- Insert – Adds a row to the borehole log.
- Delete – Removes the selected row from the borehole log.
- HGU section – Shows the HGU by depth, as well as the optional unit (if selected) of the selected borehole or well. If turned on, also shows the geophysical plots.
At the bottom of the dialog are the following buttons:
- Manage Colors – Turn this on to activate the Color Manager button.
- HGU Color Manager – Click to bring up the Hydrostratigraphy/Lithostratigraphy Color Manager dialog.
- Use Geophysical Plot – Turn this on to activate the Geophysical Setup button.
- Geophysical Setup – Click to bring up the Geophysical Plot Setup dialog.
- Copy to Clipboard – Copies the HGU section to the Windows clipboard as an image. This allows it to be pasted into another document, if desired.
- OK – Saves and changes and exits the Borehole Editor dialog.
- Cancel – Cancels any changes and exits the Borehole Editor dialog.
Geophysical Plot Setup
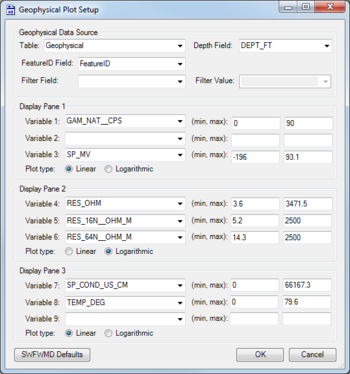
The Geophysical Plot Setup dialog is accessed by clicking the Geophysical Setup button at the bottom of the Borehole Editor Advanced dialog.
The following sections, options, and fields are available:
- Boreholes section –
- Table – Select the desired table from the drop-down.
- Depth Field – Select the depth field from the drop-down.
- FeatureID Field – Select the FeatureID field from the drop-down. The default is "FeatureID".
- Filter Field – Select the field to use as a filter.
- Filter Value – Select the filter value for the filter field.
- Display Pane 1 section Setup for the plot displayed in the first display pane in the Borehole Editor Advanced dialog.
- Variable 1 – Select the first variable from the drop-down.
- (min, max) – Enter the min and max for the first variable.
- Variable 2 – Select the second variable from the drop-down.
- (min, max) – Enter the min and max for the second variable.
- Variable 3 – Select the third variable from the drop-down.
- (min, max) – Enter the min and max for the third variable.
- Plot type – Radio button to select which type of plot to display. Select either "Linear" or "Logarithmic".
- Variable 1 – Select the first variable from the drop-down.
- Display Pane 2 section Setup for the plot displayed in the second display pane in the Borehole Editor Advanced dialog.
- Variable 4 – Select the fourth variable from the drop-down.
- (min, max) – Enter the min and max for the fourth variable.
- Variable 5 – Select the fifth variable from the drop-down.
- (min, max) – Enter the min and max for the fifth variable.
- Variable 6 – Select the sixth variable from the drop-down.
- (min, max) – Enter the min and max for the sixth variable.
- Plot type – Radio button to select which type of plot to display. Select either "Linear" or "Logarithmic".
- Variable 4 – Select the fourth variable from the drop-down.
- Display Pane 3 section Setup for the plot displayed in the third display pane in the Borehole Editor Advanced dialog.
- Variable 7 – Select the seventh variable from the drop-down.
- (min, max) – Enter the min and max for the seventh variable.
- Variable 8 – Select the eighth variable from the drop-down.
- (min, max) – Enter the min and max for the eighth variable.
- Variable 9 – Select the ninth variable from the drop-down.
- (min, max) – Enter the min and max for the ninth variable.
- Plot type – Radio button to select which type of plot to display. Select either "Linear" or "Logarithmic".
- Variable 7 – Select the seventh variable from the drop-down.
At the bottom of the dialog are the following buttons:
- SWFWMD Defaults – Loads the defaults values used by the Southwest Florida Water Management District.
- OK – Saves the changes and closes the Geophysical Plot Setup dialog.
- Cancel – Discards the changes and closes the Geophysical Plot Setup dialog.
Hydrostratigraphy/Lithostratigraphy Color Manager
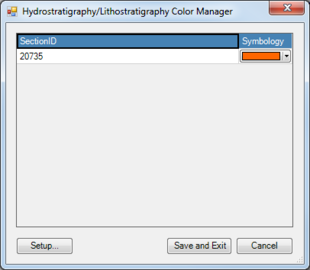
The Hydrostratigraphy/Lithostratigraphy Color Manager dialog is accessed by clicking the Color Manager button at the bottom of the Borehole Editor Advanced dialog. It has the following columns:
- First column – The name of this column changes depending on the Name Field option selected in the Color Manager Setup (Advanced) dialog. The default name for this column is HGU Name. The value displayed in the column is determined by the contents of the selected Name Field option.
- Symbology – A drop-down list allowing color selection.
There are three buttons at the bottom of the dialog:
- Setup... – Clicking this button brings up the Color Manager Setup (Advanced) dialog.
- Save and Exit – Saves any changes and exits the Hydrostratigraphy/Lithostratigraphy Color Manager dialog.
- Cancel – Discards any changes and exits the Hydrostratigraphy/Lithostratigraphy Color Manager dialog.
Color Manager Setup (Advanced)
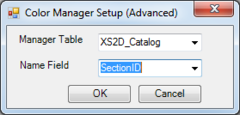
The Color Manager Setup (Advanced) dialog is accessed by clicking the Setup... button at the bottom of the Hydrostratigraphy/Lithostratigraphy Color Manager dialog. It has the following options:
- Manager Table – Select the desired table from the drop-down.
- Name Field – Select the name field used in the selected table.
- OK – Saves the changes and closes the Color Manager Setup (Advanced) dialog.
- Cancel – Discards the changes and closes the Color Manager Setup (Advanced) dialog.


