SMS:PTM Gage Coverage: Difference between revisions
(Created page with "A "PTM Gage" coverage has been added to allow the creation of virtual gages. A virtual gage can be associated with either a point or a polygon. When a virtual gage is associated...") |
No edit summary |
||
| (13 intermediate revisions by the same user not shown) | |||
| Line 1: | Line 1: | ||
A "PTM Gage" coverage has been added to allow the creation of virtual gages. A virtual gage can be associated with either a point or a polygon. When a virtual gage is associated with a point, | [[File:PTM GageAttributes.png|thumb|250 px|The ''PTM Gage Attributes'' dialog]] | ||
A "PTM Gage" coverage has been added to allow the creation of virtual gages. A virtual gage can be associated with either a point or a polygon. When a virtual gage is associated with a point, specify a radius that defines the area being monitored by the gage (creating a circle). | |||
The gages can be thought of as open traps which monitor the number parcels and material that enter the specified region during the simulation. | The gages can be thought of as open traps which monitor the number parcels and material that enter the specified region during the simulation. | ||
When | When using the [[SMS:Particle Module Compute Grid Datasets|'''Particle Module Compute Grid Datasets''']] command, choose to compute datasets associated with a grid or with a PTM Gage coverage. When the gage coverage option is selected, SMS computes output data associated with each point and/or polygon. This data consists of sets of xy series curves organized by solution and dataset name. Each curve represents a quantity related to the specific gage. These quantities include count, accumulation, concentrations, rate of exposure and all of the options supported by the '''Compute Dataset''' command including the options to bin concentration, exposure and dosage in the "Z" direction (creating 3D data). The output data is visualized using a PTM Gage plot type in the plot wizard for [[SMS:Plot Window|2D plots]]. | ||
The polygons and points in the virtual gage coverage are created with discrete color attributes. Each point has a radius attribute that represents the area over which the computations will apply. | The polygons and points in the virtual gage coverage are created with discrete color attributes. Each point has a radius attribute that represents the area over which the computations will apply. | ||
==PTM Trap Output as Gages== | ==PTM Trap Output as Gages== | ||
In addition to creating virtual point and polygon gages, the PTM Gage Coverage can also be used to view data output by PTM in its Trap Output file. This functionality does not include the concentration, dosage and exposure options, but it does allow | In addition to creating virtual point and polygon gages, the PTM Gage Coverage can also be used to view data output by PTM in its Trap Output file. This functionality does not include the concentration, dosage and exposure options, but it does allow visualizing data related to closed traps. | ||
==Related Topics== | |||
* [[SMS:PTM#PTM_Coverages|PTM Coverages]] | |||
{{Template:Navbox SMS}} | |||
[[Category:SMS Coverages|P]] | |||
[[Category:PTM|G]] | |||
Latest revision as of 21:26, 20 September 2016
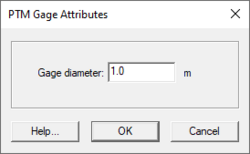
A "PTM Gage" coverage has been added to allow the creation of virtual gages. A virtual gage can be associated with either a point or a polygon. When a virtual gage is associated with a point, specify a radius that defines the area being monitored by the gage (creating a circle).
The gages can be thought of as open traps which monitor the number parcels and material that enter the specified region during the simulation.
When using the Particle Module Compute Grid Datasets command, choose to compute datasets associated with a grid or with a PTM Gage coverage. When the gage coverage option is selected, SMS computes output data associated with each point and/or polygon. This data consists of sets of xy series curves organized by solution and dataset name. Each curve represents a quantity related to the specific gage. These quantities include count, accumulation, concentrations, rate of exposure and all of the options supported by the Compute Dataset command including the options to bin concentration, exposure and dosage in the "Z" direction (creating 3D data). The output data is visualized using a PTM Gage plot type in the plot wizard for 2D plots.
The polygons and points in the virtual gage coverage are created with discrete color attributes. Each point has a radius attribute that represents the area over which the computations will apply.
PTM Trap Output as Gages
In addition to creating virtual point and polygon gages, the PTM Gage Coverage can also be used to view data output by PTM in its Trap Output file. This functionality does not include the concentration, dosage and exposure options, but it does allow visualizing data related to closed traps.
Related Topics
SMS – Surface-water Modeling System | ||
|---|---|---|
| Modules: | 1D Grid • Cartesian Grid • Curvilinear Grid • GIS • Map • Mesh • Particle • Quadtree • Raster • Scatter • UGrid |  |
| General Models: | 3D Structure • FVCOM • Generic • PTM | |
| Coastal Models: | ADCIRC • BOUSS-2D • CGWAVE • CMS-Flow • CMS-Wave • GenCade • STWAVE • WAM | |
| Riverine/Estuarine Models: | AdH • HEC-RAS • HYDRO AS-2D • RMA2 • RMA4 • SRH-2D • TUFLOW • TUFLOW FV | |
| Aquaveo • SMS Tutorials • SMS Workflows | ||
