GMS:TIN Display Options
From XMS Wiki
(Redirected from GMS:TIN Display Options Vertices)
Jump to navigationJump to search
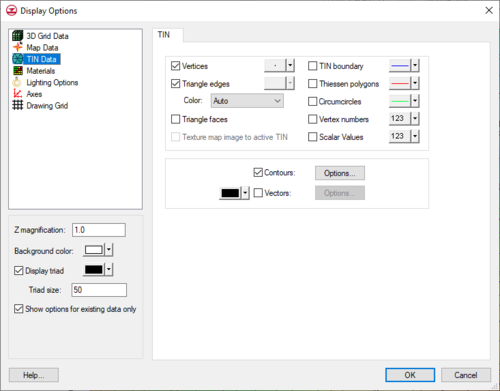
The properties of all TIN data that GMS displays on the screen can be controlled through the TIN Data tab of the Display Options dialog. This dialog is opened by right-clicking on the ![]() TIN Data entry in the Project Explorer and selecting the Display Options command. It can also be accessed from the from the Display menu or the Display Options
TIN Data entry in the Project Explorer and selecting the Display Options command. It can also be accessed from the from the Display menu or the Display Options ![]() macro. The following table describes the display options available for the TIN module.
macro. The following table describes the display options available for the TIN module.
| Display Option | Description |
|---|---|
| Vertices | If the Vertices item in the TIN Display Options dialog is set, the TIN vertices are displayed each time the Graphics Window is refreshed. Since it is possible to accidentally drag points, vertices can be "locked" to prevent them from being dragged or edited by selecting the Lock ALL Vertices command from the TINs menu. Vertices can be unlocked by unchecking the Lock ALL Vertices command in the TINs menu. Both a "Locked" and "Unlocked" vertex color may be set so that there is a visible difference when displaying the TIN. (See Editing a TIN) |
| Triangle edges | If this item is on, the lines that make up each triangle are displayed. The color of the triangle edges can be adjusted according to the following options:
|
| Triangle faces | Draws the faces of triangles as filled polygons. |
| Texture map image to active TIN | The Texture map image item is used to "drape" an image over the surface of the TIN. |
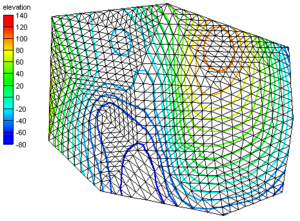
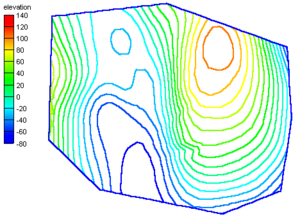
| TIN boundary | The TIN boundary feature is often used in conjunction with contours in order to display the contours without cluttering the screen by displaying each triangle. The first image below shows contours displayed together with the TIN triangles. The second image shows contours displayed with the TIN boundary.
|
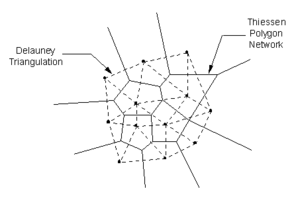
| Thiessen polygons | Draws a Thiessen polygon for each TIN vertex each time the display is refreshed. The edges of the Thiessen polygons are formed by the perpendicular bisectors of the edges of the triangles in the TIN. The vertices of these polygons correspond to the centers of the circumcircles of the Delaunay triangulation. Any location inside a Thiessen polygon is closer to the TIN vertex contained in that polygon than to any other TIN vertex. The polygons with solid borders in the image below correspond to the Thiessen polygons for this TIN.
|
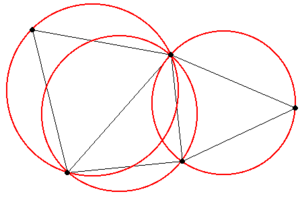
| Circumcircles | Draws the circumcircle enclosing the three vertices for each triangle when the display is refreshed. Circumcircles provide the basis of a Delaunay triangulation since the Delaunay criterion is satisfied by ensuring that no circumcircle encloses a vertex. Displaying circumcircles can aid in the understanding of the triangulation process. The red circles in the figure are the circumcircles for the TIN.
|
| Vertex numbers | Displays the number of each vertex adjacent to the vertex. |
| Scalar values | Displays the active dataset value of each vertex adjacent to the vertex. |
| Contours | Most of the objects supported by GMS can be contoured by turning on the Contour Options in the Display Options dialog. When an object is contoured, the values associated with the active dataset for the object are used to generate the contours. |
| Vectors | If the Vectors item in the Display Options dialog is selected for an object (TIN, Grid, or Mesh), vector plots can be generated using the active vector dataset for the object. One vector is placed at each node, cell, or vertex. |
| GMS – Groundwater Modeling System | ||
|---|---|---|
| Modules: | 2D Grid • 2D Mesh • 2D Scatter Point • 3D Grid • 3D Mesh • 3D Scatter Point • Boreholes • GIS • Map • Solid • TINs • UGrids | |
| Models: | FEFLOW • FEMWATER • HydroGeoSphere • MODAEM • MODFLOW • MODPATH • mod-PATH3DU • MT3DMS • MT3D-USGS • PEST • PHT3D • RT3D • SEAM3D • SEAWAT • SEEP2D • T-PROGS • ZONEBUDGET | |
| Aquaveo | ||
Hidden category:
