SMS:Plot Data Coverage: Difference between revisions
From XMS Wiki
Jump to navigationJump to search
(Created page with "The Plot Data coverage is a generic coverage in the Map module. The coverage allows showing where a proposed structures, such as a bridge or culvert,...") |
No edit summary |
||
| (One intermediate revision by the same user not shown) | |||
| Line 1: | Line 1: | ||
The Plot Data coverage is a [[SMS:Generic Coverages|generic coverage]] in the Map module. The coverage allows showing where a proposed | The Plot Data coverage is a [[SMS:Generic Coverages|generic coverage]] in the Map module. The coverage allows showing where a proposed structure, such as a bridge or culvert, will appear on a profile plot. It is used in conjunction with an [[SMS:Observation_Coverage|Observation coverage]]. When present, a Plot Data coverage can be used when generating an [[SMS:Observation Profile Plot|observation profile plot]]. | ||
[[File:SMS PlotDataDialog.png|thumb|300 px|The ''Plot Data'' dialog]] | [[File:SMS PlotDataDialog.png|thumb|300 px|The ''Plot Data'' dialog]] | ||
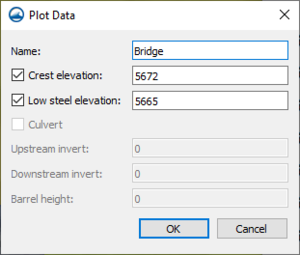
Polygons are created on the coverage to help highlight data. Attributes can be assigned to these polygons ''Plot Data'' dialog. The dialog | Polygons are created on the coverage to help highlight data. Attributes can be assigned to these polygons in a ''Plot Data'' dialog. The dialog has the following options: | ||
* ''Name'' – Enter a name for the plot data. This will appear in the profile plot. | * ''Name'' – Enter a name for the plot data. This will appear in the profile plot. | ||
* ''Crest elevation'' – The height in which overtopping will occur, generally the top of a bridge or similar structure. | * ''Crest elevation'' – The height in which overtopping will occur, generally the top of a bridge or similar structure. | ||
Latest revision as of 01:05, 25 November 2021
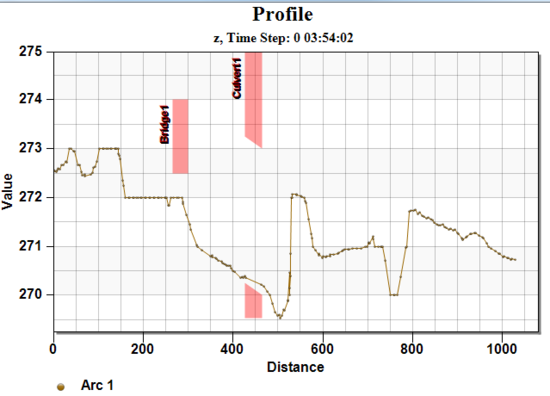
The Plot Data coverage is a generic coverage in the Map module. The coverage allows showing where a proposed structure, such as a bridge or culvert, will appear on a profile plot. It is used in conjunction with an Observation coverage. When present, a Plot Data coverage can be used when generating an observation profile plot.
Polygons are created on the coverage to help highlight data. Attributes can be assigned to these polygons in a Plot Data dialog. The dialog has the following options:
- Name – Enter a name for the plot data. This will appear in the profile plot.
- Crest elevation – The height in which overtopping will occur, generally the top of a bridge or similar structure.
- Low steel elevation – The ceiling height of a bridge or similar structure.
- Culvert – This option will change the profile plot to show where flow will go through a proposed culvert.
- Upstream invert – The entry point of the culvert.
- Downstream invert – The exit point of the culvert.
- Barrel height – The height of the barrel. Determines the space amount on the profile plot.
In the Plot Wizard the plot data coverage is selected to apply the parameters to the profile plot.
Related Topics
SMS – Surface-water Modeling System | ||
|---|---|---|
| Modules: | 1D Grid • Cartesian Grid • Curvilinear Grid • GIS • Map • Mesh • Particle • Quadtree • Raster • Scatter • UGrid |  |
| General Models: | 3D Structure • FVCOM • Generic • PTM | |
| Coastal Models: | ADCIRC • BOUSS-2D • CGWAVE • CMS-Flow • CMS-Wave • GenCade • STWAVE • WAM | |
| Riverine/Estuarine Models: | AdH • HEC-RAS • HYDRO AS-2D • RMA2 • RMA4 • SRH-2D • TUFLOW • TUFLOW FV | |
| Aquaveo • SMS Tutorials • SMS Workflows | ||

