GMS:2D Grid Display Options: Difference between revisions
From XMS Wiki
Jump to navigationJump to search
No edit summary |
No edit summary |
||
| (22 intermediate revisions by 4 users not shown) | |||
| Line 1: | Line 1: | ||
{{2D Grid links}} | {{2D Grid links}} | ||
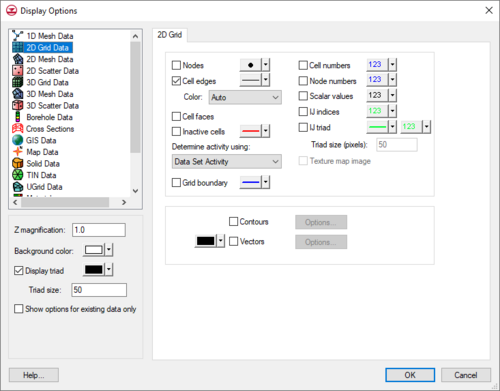
The properties of all [[GMS:2D Grid Module|2D | The properties of all [[GMS:2D Grid Module|2D grid]] data that GMS displays on the screen can be controlled through the ''2D Grid'' tab of the [[GMS:Display Options|''Display Options'']] dialog. This dialog is opened by right-clicking on the "[[File:2D Grid Folder.svg|16 px]] 2D Grid Data" entry in the [[GMS:Project Explorer|Project Explorer]] and selecting the '''Display Options''' command. It can also be accessed from the ''Display'' menu or the '''Display Options''' [[File:Display Options Macro.svg|16 px]] macro. The following table describes the display options available for the 2D Grid module. | ||
{| class="wikitable" | {| class="wikitable" | ||
! width="125" | Display Option !! Description | ! width="125" | Display Option !! Description | ||
|- | |- | ||
| Nodes || | | Nodes || Displays grid nodes on the corners of the cells for both mesh- and cell-centered [[GMS:2D Grid Module#Grid Types|grid types]]. | ||
|- | |- | ||
| Cell edges || The Cell edges item | | Cell edges || The ''Cell edges'' item displays the edges of grid cells. The cells are either drawn using the default cell color or the color of the material associated with each cell. | ||
In addition to turning the display of cells on or off, | <!--In addition to turning the display of cells on or off, grid cells can be temporarily hidden.--> | ||
The color of the cell edges can be adjusted according to the following options: | The color of the cell edges can be adjusted according to the following options: | ||
#Auto – | #Auto – Draws the [[GMS:Materials|material]] color if faces are not displayed. Uses the color specified next to ''Cell edges'' if the faces are displayed. | ||
#Specified – | #Specified – Used the color specified next to the cell edges. | ||
#Material – | #Material – Displays the material color of the cell. | ||
|- | |- | ||
| Cell faces || | | Cell faces || Draws the faces of the grid cells as filled polygons. | ||
|- | |- | ||
| Inactive cells || | | [[GMS:Active/Inactive Cells|Inactive cells]] || Displays cells which are inactive. If this option is turned off, inactive cells are not displayed. Inactive cells must be displayed before they can be selected. | ||
|- | |- | ||
| | |Determine activity using || Sets the criteria for determining which cells to consider inactive. | ||
|- | |- | ||
| | | Grid boundary || The ''Grid boundary'' item displays a solid line around the perimeter of the grid. Displaying the boundary is useful when contours are being displayed with the cell edges turned off. | ||
|- | |- | ||
| | | Cell numbers || Displays the ID of each grid cell. | ||
|- | |- | ||
| | | Node numbers || Displays the ID of each grid node. | ||
|- | |- | ||
| | | Scalar values || Displays the scalar values of the active dataset for each node next to the node. | ||
|- | |- | ||
| IJ | | IJ indices || Displays the ij indices of each cell or node. | ||
|- | |- | ||
| | | IJ triad || Displays a symbol at one of the corners of the grid showing the orientation of the ij axes. | ||
|- | |- | ||
| | | Texture map image || The ''Texture map image'' item is used to "drape" an [[GMS:Images|image]] over the surface of the 2D Grid. | ||
|- | |- | ||
| Vectors || If the [[GMS:Vectors|Vectors]] item in the Display Options dialog is selected for an object (TIN, | | Contours|| Most of the objects supported by GMS can be contoured by turning on the [[GMS:Contour Options|Contour Options]] in the ''Display Options'' dialog. When an object is contoured, the values associated with the active dataset for the object are used to generate the contours. | ||
|- | |||
| Vectors || If the [[GMS:Vectors|''Vectors'']] item in the ''Display Options'' dialog is selected for an object (TIN, grid, or mesh), vector plots can be generated using the active vector dataset for the object. One vector is placed at each node, cell, or vertex. | |||
|} | |} | ||
:[[File:Display2DGrid.png|thumb|none|left|500 px|The ''Display Options'' dialog showing the ''2D Grid'' tab.]] | |||
{{Navbox GMS}} | {{Navbox GMS}} | ||
[[Category:2D Grid]] | [[Category:2D Grid|Dis]] | ||
[[Category:GMS Display Options]] | [[Category:GMS Display Options]] | ||
[[Category:GMS Display Dialogs]] | |||
[[Category:2D Grid Dialogs|Display]] | |||

