SMS:GIS Module Display Options: Difference between revisions
From XMS Wiki
Jump to navigationJump to search
No edit summary |
No edit summary |
||
| (4 intermediate revisions by the same user not shown) | |||
| Line 1: | Line 1: | ||
[[File:SMS GIS | [[File:SMS GIS DisplayOpts.png|thumb|500 px|''Display Options'' dialog showing ''GIS'' options]] | ||
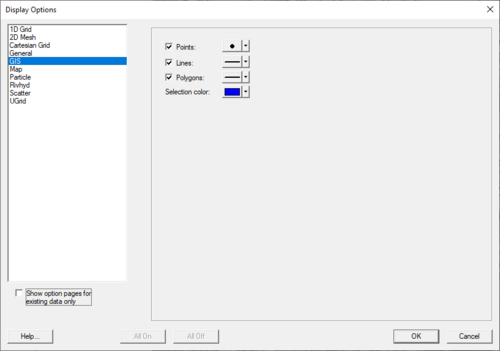
The properties of the GIS Module data SMS displays on the screen can be controlled through the ''[[SMS:Display Options|Display Options]]'' dialog. The | The properties of the GIS Module data SMS displays on the screen can be controlled through the ''[[SMS:Display Options|Display Options]]'' dialog. The options are used with shapefiles that have been imported into the project. The available ''GIS Module Display Options'' include the following: | ||
*''Points'' – Opens the ''Point Attributes'' dialog where the diameter and color of points can be selected. | |||
* '' | *''Lines'' – Opens the ''Line Attributes'' dialog where the width and color of lines can be selected. Also allows selecting if lines will be solid or dashed. | ||
*''Polygons'' Opens the ''Line Attributes'' dialog where the width and color of polygon lines can be selected. Also allows selecting if lines will be solid or dashed. | |||
*''Select color'' Open the ''Color'' dialog where the color of selected options can be determined. | |||
<!-- | |||
* ''Rasters'' | * ''Rasters'' | ||
**''Display as 2D image'' – makes it so the raster is only visible in plan view (like other images). This option is fast and memory efficient and can support large rasters (or several rasters). | **''Display as 2D image'' – makes it so the raster is only visible in plan view (like other images). This option is fast and memory efficient and can support large rasters (or several rasters). | ||
***''Enable hill shading'' – toggle on to show shadows and thus makes the image appear 3D. | |||
**''Enable hill shading'' – toggle on to show shadows and thus makes the image appear 3D. | |||
**''Display as 3D image'' – makes it so the raster is visible in any view, not just plan view. 3D points are also very memory efficient but may be a little slower than the 2D image option. Also, hill shading is not available in this mode. | **''Display as 3D image'' – makes it so the raster is visible in any view, not just plan view. 3D points are also very memory efficient but may be a little slower than the 2D image option. Also, hill shading is not available in this mode. | ||
***''Point size'' – specifies the size of points displayed. | |||
**''Point size'' – specifies the size of points displayed. | ***''Maximum points'' – sets a limit to the number of points to generate. Specifying a maximum number of points can be useful if the size of the raster is such that rendering becomes slow. | ||
**''Maximum points'' – sets a limit to the number of points to generate. Specifying a maximum number of points can be useful if the size of the raster is such that rendering becomes slow. | |||
**''Shader'' – with either 2D or 3D, four different shaders, which control the color ramp, are available. The shaders available are: | **''Shader'' – with either 2D or 3D, four different shaders, which control the color ramp, are available. The shaders available are: | ||
***Atlas Shader | |||
**Atlas Shader | ***Color Ramp Shader | ||
**Color Ramp Shader | ***Global Shader | ||
**Global Shader | ***HSV Shader | ||
**HSV Shader | --> | ||
==Related Topics== | ==Related Topics== | ||
Latest revision as of 17:25, 20 May 2022
The properties of the GIS Module data SMS displays on the screen can be controlled through the Display Options dialog. The options are used with shapefiles that have been imported into the project. The available GIS Module Display Options include the following:
- Points – Opens the Point Attributes dialog where the diameter and color of points can be selected.
- Lines – Opens the Line Attributes dialog where the width and color of lines can be selected. Also allows selecting if lines will be solid or dashed.
- Polygons Opens the Line Attributes dialog where the width and color of polygon lines can be selected. Also allows selecting if lines will be solid or dashed.
- Select color Open the Color dialog where the color of selected options can be determined.
Related Topics
| [show] SMS Display Options |
|---|
| [hide] SMS – Surface-water Modeling System | ||
|---|---|---|
| Modules: | 1D Grid • Cartesian Grid • Curvilinear Grid • GIS • Map • Mesh • Particle • Quadtree • Raster • Scatter • UGrid |  |
| General Models: | 3D Structure • FVCOM • Generic • PTM | |
| Coastal Models: | ADCIRC • BOUSS-2D • CGWAVE • CMS-Flow • CMS-Wave • GenCade • STWAVE • WAM | |
| Riverine/Estuarine Models: | AdH • HEC-RAS • HYDRO AS-2D • RMA2 • RMA4 • SRH-2D • TUFLOW • TUFLOW FV | |
| Aquaveo • SMS Tutorials • SMS Workflows | ||
