SMS:Data Toolbar: Difference between revisions
No edit summary |
|||
| Line 5: | Line 5: | ||
===Measure Tool=== | ===Measure Tool=== | ||
The '''Measure Tool''' [[Image:Measure_tool.png]] is used to measure distances interactively. When clicking in the graphics window, a line will show the distance being measured and the [[SMS:Help or Status Window#Coordinates Bar|''Coordinates Bar'']] will show the total numerical value. The units used to report the measured distance is specified on the ''Toolbars'' tab of the [[SMS:Preferences#Toolbars|''Preferences '']] dialog—either the project unit as set in the ''[[Projections]]'' dialog or user-specified units. | The '''Measure Tool''' [[Image:Measure_tool.png]] is used to measure distances interactively. When clicking in the graphics window, a line will show the distance being measured and the [[SMS:Help or Status Window#Coordinates Bar|''Coordinates Bar'']] will show the total numerical value. The units used to report the measured distance is specified on the ''Toolbars'' tab of the [[SMS:Preferences#Toolbars|''Preferences '']] dialog—either the project unit as set in the ''[[Projections]]'' dialog or user-specified units. | ||
<!-- | |||
The '''Measure Tool''' [[Image:Measure_tool.png]] is used to measure distances interactively. When this tool is active, and the user clicks in the graphics window, clicking in the graphics window, a line appears from the click location to the cursor location. Subsequent clicks add points to a polyline. | |||
At the bottom of the screen in the status message, SMS diplays the following: | |||
* The total length of the measure tool polyline | |||
* The length of the last segment in the polyline | |||
* The ''Angle of change'' or deviation between the last two segments in the polyline. If the last segment is a continuation from the previous segment, this deviation is 0.0. If the last segment reverses the direction of the previous segment this deviation is 180.0. One application of this information is to determine the angle of skew between a geometric feature such as a channel and a bridge or embankment crossing the channel. (This feature was added to SMS in version 13.0) | |||
* The average slope of the last segment based on the active module and the existence of elevation/depth data in that module. For example, if the active module is the Map module, no elevation data is tracked so this information is not computed/displayed. Also, if the cursor leaves the active geometry such as the TIN/Mesh/Ugrid, this information is not computed/displayed. This slope can be used to compute normal depth of flow using the Manning's equation. (This feature was added to SMS in version 13.0) | |||
The distance total length is also displayed in at the bottom of the Graphics window in the [[SMS:Help or Status Window#Coordinates Bar|''Coordinates Bar'']]. | |||
The units used to report the measured distance is specified on the ''Toolbars'' tab of the [[SMS:Preferences#Toolbars|''Preferences '']] dialog—either the project unit as set in the ''[[Projections|Display Projections]]'' dialog or user-specified units.--> | |||
===Get Data Tool=== | ===Get Data Tool=== | ||
Revision as of 18:06, 3 March 2017
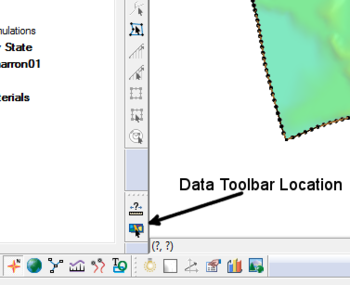
The Data Toolbar contains tools to query or obtain data. Whether the toolbar appears at startup is set in the Preferences dialog.
The following tools are available:
Measure Tool
The Measure Tool File:Measure tool.png is used to measure distances interactively. When clicking in the graphics window, a line will show the distance being measured and the Coordinates Bar will show the total numerical value. The units used to report the measured distance is specified on the Toolbars tab of the Preferences dialog—either the project unit as set in the Projections dialog or user-specified units.
Get Data Tool
The Get Data Tool ![]() is used to specify the location of interest for obtaining data using the import from web feature. Click and drag in the main graphics window to specify the area to be downloaded. The Data Service Options dialog will then appear and the web service or catalog can be selected for downloading the data. SMS will ask to save the data file before downloading the data and importing it into SMS. The data will appear in the GIS module.
is used to specify the location of interest for obtaining data using the import from web feature. Click and drag in the main graphics window to specify the area to be downloaded. The Data Service Options dialog will then appear and the web service or catalog can be selected for downloading the data. SMS will ask to save the data file before downloading the data and importing it into SMS. The data will appear in the GIS module.
This tool is not available if a display projection has not been specified. The tool will determine the data location based on the display projection.
Related Topics
SMS Toolbars | |
|---|---|
| Standard Toolbars: | Data • Macros (Display, File, Optional Macro) • Module Toolbar • Static Tools |
| Dynamic Tools | 1D Grid • 2D Mesh Module • Annotations • Cartesian Grid Module • Curvilinear Grid • GIS Module • Map Module • Particle Module • Quadtree • Scatter Module |
| Quick Tour • Layout | |
SMS – Surface-water Modeling System | ||
|---|---|---|
| Modules: | 1D Grid • Cartesian Grid • Curvilinear Grid • GIS • Map • Mesh • Particle • Quadtree • Raster • Scatter • UGrid |  |
| General Models: | 3D Structure • FVCOM • Generic • PTM | |
| Coastal Models: | ADCIRC • BOUSS-2D • CGWAVE • CMS-Flow • CMS-Wave • GenCade • STWAVE • WAM | |
| Riverine/Estuarine Models: | AdH • HEC-RAS • HYDRO AS-2D • RMA2 • RMA4 • SRH-2D • TUFLOW • TUFLOW FV | |
| Aquaveo • SMS Tutorials • SMS Workflows | ||
