GMS:Display Options: Difference between revisions
(avoid redir) |
No edit summary |
||
| Line 31: | Line 31: | ||
| align = "center" | [[File:WMSIcon GIS Module.png]] || align = "center" | [[GMS:GIS Display Options|GIS Data]] || | | align = "center" | [[File:WMSIcon GIS Module.png]] || align = "center" | [[GMS:GIS Display Options|GIS Data]] || | ||
|- | |- | ||
| align = "center" | [[File:Tool CreateCrossSection. | | align = "center" | [[File:Tool CreateCrossSection.png]] || align = "center" | [[GMS:Cross Sections#Cross-Section Options|Cross Sections]] || | ||
|- | |- | ||
| align= "center" | [[File:MaterialsDisplayOptionsIcon.png]] || align = "center" | [[GMS:Materials|Materials]] || | | align= "center" | [[File:MaterialsDisplayOptionsIcon.png]] || align = "center" | [[GMS:Materials|Materials]] || | ||
Revision as of 21:52, 21 October 2015
Most of the data types in GMS have a set of display options that can be modified using the Display Options command in the Display menu. The Display Options command brings up the Display Options dialog. The dialog can also be brought up using the ![]() Display Options macro.
Display Options macro.
Data Type Tabs
The Display Options dialog contains a list of the data objects currently in memory. Corresponding data tabs are displayed in the dialog depending on what object type is selected in the list box. Each display feature associated with a data type is listed in the Display Options dialog. The check box next to the feature named can be toggled on or off to control whether or not the feature is to be displayed. In addition, the button next to the feature brings up a dialog that can be used to edit the display attributes of the feature (color, font, line thickness, etc.). The following table describes the display options tabs that exist for the various data types. Click on the links to learn more about the specific display options for each data type.
General Display Options
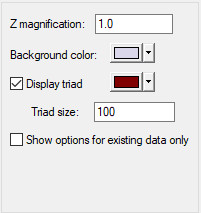
The Display Options dialog also controls several general display options in GMS. These general display options are described in the table below.
| Display Option | Description |
|---|---|
| Z magnification | Occasionally an object may be very long and wide with respect to its overall depth (z dimension). In such cases, it is possible to exaggerate the z scale so that the variation in the z value is more apparent by changing the magnification factor from the default value of 1.0. |
| Background color | The Color dialog can be brought up to change the selected color. The selected color is displayed as the background color in the Graphics Window. |
| Triad options | To aide in visualization of 3D objects in oblique view, a XYZ triad can be displayed in the lower left corner of the Graphics Window. The display, size, and color of the triad can be specified in the Display Options dialog. The triad is useful in visualizing how the geometry currently defined in GMS aligns with the world coordinate system. |
See also
GMS – Groundwater Modeling System | ||
|---|---|---|
| Modules: | 2D Grid • 2D Mesh • 2D Scatter Point • 3D Grid • 3D Mesh • 3D Scatter Point • Boreholes • GIS • Map • Solid • TINs • UGrids | |
| Models: | FEFLOW • FEMWATER • HydroGeoSphere • MODAEM • MODFLOW • MODPATH • mod-PATH3DU • MT3DMS • MT3D-USGS • PEST • PHT3D • RT3D • SEAM3D • SEAWAT • SEEP2D • T-PROGS • ZONEBUDGET | |
| Aquaveo | ||
