SMS:Scatter Module Display Options: Difference between revisions
From XMS Wiki
Jump to navigationJump to search
No edit summary |
No edit summary |
||
| Line 11: | Line 11: | ||
* ''Point Names'' – The name of the selected scatter set can be changed. | * ''Point Names'' – The name of the selected scatter set can be changed. | ||
* ''Point Numbers'' – The scatter point id number can be displayed next to each node. Font and color can be selected. | * ''Point Numbers'' – The scatter point id number can be displayed next to each node. Font and color can be selected. | ||
* ''Scalar values'' – The scalar value of the active function is displayed next to each point. The | * ''Scalar values'' – The scalar value of the active function is displayed next to each point. The '''Options''' button opens the [[SMS:Scalar Value Options|''Scalar Value Options'']] dialog. | ||
** ''Use contour color scheme'' – Use the color ramp specified for the contours for text color rather than a specified color. | ** ''Use contour color scheme'' – Use the color ramp specified for the contours for text color rather than a specified color. | ||
Revision as of 16:21, 14 December 2017
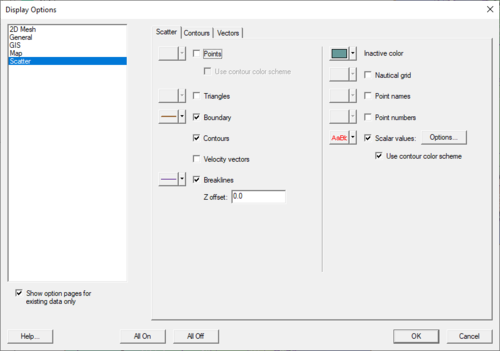
The properties of the scatter data SMS displays on the screen can be controlled through the Display Options dialog. The entities associated with the scatter module with display options are shown below. Some of these entities also show an Options button to the right. For these entities, additional display controls are available. The available display options include the following:
- Points – A symbol is drawn at each point. The type, radius, and color of these symbols can be specified. The toggle below the Points item specifies that rather than coloring the symbols with the specified color, a contour color should be used based on the current scalar value at the point. This gives a contouring effect without generating/displaying the contours.
- Triangles – Triangle edges are drawn using the specified line attributes. Line attributes include color, thickness, and style (dashed/solid).
- Boundary – A line around the perimeter of the scatter set can be drawn. This is useful when the triangles are turned off. Line color and thickness can be specified.
- Contours – The scatter contours are drawn for the active scalar data set for the active scatter set. All standard contour display options are supported for scatter contours.
- Velocity Vectors – The scatter vectors are drawn for the active vector data set of the active scatter set. Display options are set through the Vector Display Options dialog.
- Inactive Color – Only the active scatter set is displayed in its color. All other scatter sets are displayed using the inactive color. This helps to avoid clutter on the screen.
- Nautical Grid
- Point Names – The name of the selected scatter set can be changed.
- Point Numbers – The scatter point id number can be displayed next to each node. Font and color can be selected.
- Scalar values – The scalar value of the active function is displayed next to each point. The Options button opens the Scalar Value Options dialog.
- Use contour color scheme – Use the color ramp specified for the contours for text color rather than a specified color.
The display of individual scatter sets can be turned on or off through the Project Explorer.
Related Topics
SMS Display Options | |
|---|---|
| Modules | Mesh Module • Cartesian Grid Module • 3D Cartesian Grid Module • Scatter Module • Map Module • GIS Module • Particle Module |
| Datasets | Contour Options • Vector Options |
SMS – Surface-water Modeling System | ||
|---|---|---|
| Modules: | 1D Grid • Cartesian Grid • Curvilinear Grid • GIS • Map • Mesh • Particle • Quadtree • Raster • Scatter • UGrid |  |
| General Models: | 3D Structure • FVCOM • Generic • PTM | |
| Coastal Models: | ADCIRC • BOUSS-2D • CGWAVE • CMS-Flow • CMS-Wave • GenCade • STWAVE • WAM | |
| Riverine/Estuarine Models: | AdH • HEC-RAS • HYDRO AS-2D • RMA2 • RMA4 • SRH-2D • TUFLOW • TUFLOW FV | |
| Aquaveo • SMS Tutorials • SMS Workflows | ||
