SMS:Observation Coverage: Difference between revisions
| Line 33: | Line 33: | ||
* [[SMS:Plot Wizard|Plot Wizard]] | * [[SMS:Plot Wizard|Plot Wizard]] | ||
{{Template: | |||
{{Template:Navbox SMS}} | |||
[[Category:SMS Map|Observation Coverage]] | [[Category:SMS Map|Observation Coverage]] | ||
Revision as of 18:08, 14 November 2012
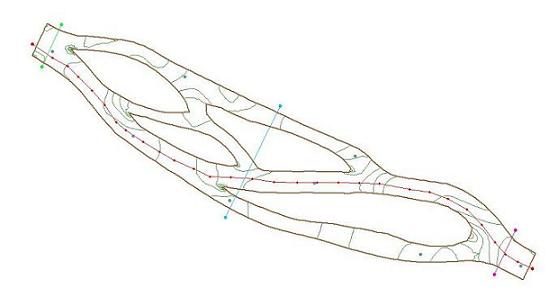
SMS contains what is called an observation coverage that is designed to help in model verification and calibration processes. Result verification is an important part of the computer modeling process. SMS includes a number of powerful tools, associated with an observation coverage, that allow users to verify simulation results with observed data. The two tools used for verification and calibration in an observation coverage are observation points and observation arcs. Observation points are used to verify the numerical analysis with measured field data such as water surface elevation or velocity data. They are also be used to see how computed values change with time at a particular location. Observation arcs are used to view the results at a cross section or along the river profile. These tools can be used with any of the SMS models.
Creating an Observation Coverage
To create a new observation coverage:
- Right-click the Map Data item in the Project Explorer
- Select New Coverage from the right click menu
- Set the coverage type to Generic → Observation in the New Coverage Dialog
- Set the coverage name as desired
- Click OK to exit the dialog
Alternatively, an existing coverage can be changed to an observation coverage by right clicking on the coverage in the Project Explorer and setting the type to Observation using the right click menu.
Creating an Observation Point
Observation points are created at locations in the model where calibration data such as the velocity or water surface elevation has been measured in the field. Each observation point is used to compare the measured values with the values computed by the model at the point's x, y location. This comparison can assist the modeler in determining the accuracy of the numerical model results. If the numerical model results do not match the observed field data, model parameters such as manning's roughness may need to be modified to obtain more accurate results.
Creating an observation point is just like creating a feature point in any other coverage type. Select the Create Feature Point tool from the Dynamic Toolbar and click the location for the feature point.
Creating an Observation Arc
Observation arcs are created at cross sections in the model where calibration data such as the flowrate has been measured in the field. Observation arcs compute fluxes across the arc. Therefore, measurements for observation arcs are called Flux Measurements. Each obseration arc is used to compare the measured values with the values computed by the model across the vertical plane defined by the arc. This comparison can assist the modeler in determining the accuracy of the numerical model results. If the numerical model results do not match the observed field data, model parameters such as manning's roughness may need to be modified to obtain more accurate results.
Creating an observation arc is just like creating a feature arc in any other coverage type. Select the Create Feature Arc tool from the Dynamic Toolbar and click out your arc. Double-click to end the arc. In an observation coverage, profile arcs and cross section arcs may be useful to analyze a simulation's solution.
Setting Observation Object Attributes
Observation point and arc attributes are defined in the Observation Coverage dialog. See Observation Coverage dialog for a description of the Observation Coverage dialog.
Viewing Results
In addition to viewing the results of the solution data versus the observed data on the calibration targets, additional plots can be created using the Plot Wizard. See Plot Wizard for a description of the available plot types.
Related Topics
SMS – Surface-water Modeling System | ||
|---|---|---|
| Modules: | 1D Grid • Cartesian Grid • Curvilinear Grid • GIS • Map • Mesh • Particle • Quadtree • Raster • Scatter • UGrid |  |
| General Models: | 3D Structure • FVCOM • Generic • PTM | |
| Coastal Models: | ADCIRC • BOUSS-2D • CGWAVE • CMS-Flow • CMS-Wave • GenCade • STWAVE • WAM | |
| Riverine/Estuarine Models: | AdH • HEC-RAS • HYDRO AS-2D • RMA2 • RMA4 • SRH-2D • TUFLOW • TUFLOW FV | |
| Aquaveo • SMS Tutorials • SMS Workflows | ||
