|
|
| (29 intermediate revisions by 4 users not shown) |
| Line 1: |
Line 1: |
| {{Solid links}} | | {{Solid links}} |
| Cross sections - also referred to as fence diagrams - are flat surfaces used to visualize the subsurface. GMS has different types of cross section objects: | | Cross sections—also referred to as fence diagrams—are flat surfaces used to visualize the subsurface. GMS has different types of cross section objects: |
| *Solid Cross Sections | | *Solid Cross Sections |
| *[[GMS:Borehole Cross Sections|Borehole Cross Sections]] | | *[[GMS:Borehole Cross Sections|Borehole Cross Sections]] |
| Line 7: |
Line 7: |
|
| |
|
| ==Solid Cross Sections== | | ==Solid Cross Sections== |
| Solid cross sections can be created by "slicing" through a set of solids using the [[GMS:Solid Module Tool Palette|Create Cross Section tool]]. This can be done at any angle and the slicing can be done using a multi-segment polyline. Solid cross sections can be [[GMS:Convert Cross Section To Coverage|converted to a conceptual model]]. This is useful if you have a solid model of an embankment that you want to analyze using [[GMS:UTEXAS|UTEXAS]]. | | Solid cross sections can be created by "slicing" through a set of solids using the [[GMS:Solid Module Tool Palette|'''Create Cross Section''' tool]]. This can be done at any angle and the slicing can be done using a multi-segment polyline. Solid cross sections can be [[GMS:Cross Sections#Convert_Cross_Section_to_Coverage|converted to a conceptual model]]. This is useful if there is a solid model of an embankment to analyze using [[GMS:UTEXAS|UTEXAS]]. |
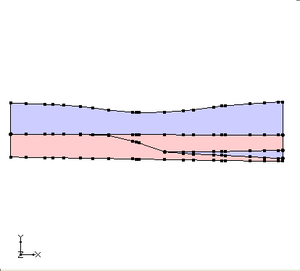
| [[Image:xsect.png|thumb|250px|none|Example of fence diagrams created using solids]] | | [[Image:xsect.png|thumb|250px|none|Example of fence diagrams created using solids]] |
|
| |
|
| Line 15: |
Line 15: |
|
| |
|
| ==3D Grid Cross Sections== | | ==3D Grid Cross Sections== |
| 3D grid cross sections are [[GMS:3D Grid Tool Palette|created]] similar to solid cross sections. Data sets are automatically interpolated from the 3D grid to the cross sections and contours can be displayed on the cross sections. | | 3D grid cross sections are [[GMS:3D Grid Tool Palette|created]] similar to solid cross sections. Datasets are automatically interpolated from the 3D grid to the cross sections and contours can be displayed on the cross sections. |
| [[Image:Xsects_3dg.png|thumb|250px|none|Two cross sections cut through a 3D grid]] | | [[Image:Xsects_3dg.png|thumb|250px|none|Two cross sections cut through a 3D grid]] |
|
| |
|
| ==3D Mesh Cross Sections== | | ==3D Mesh Cross Sections== |
| 3D mesh cross sections are [[GMS:3D Mesh Tool Palette|created]] similar to solid cross sections. Data sets are automatically interpolated from the 3D mesh to the cross sections and contours can be displayed on the cross sections. | | 3D mesh cross sections are [[GMS:3D Mesh Tool Palette|created]] similar to solid cross sections. Datasets are automatically interpolated from the 3D mesh to the cross sections and contours can be displayed on the cross sections. |
| [[Image:Xsect_3dm.png|thumb|250px|none|Multi-panel cross section cut through a 3D mesh]] | | [[Image:Xsect_3dm.png|thumb|250px|none|Multi-panel cross section cut through a 3D mesh]] |
|
| |
|
| ===Cross-Section Options===
| | ==Cross Section Options== |
| | When cross sections are created from a mesh or a grid, values of the active scalar and vector datasets are interpolated to the cross sections. Whenever a new dataset is chosen as the active dataset for the mesh, the data values are re-interpolated to the cross sections. |
|
| |
|
| When cross sections are created from a mesh or a grid, values of the active scalar and vector data sets are interpolated to the cross sections. Whenever a new data set is chosen as the active data set for the mesh, the data values are re-interpolated to the cross sections.
| | The properties of all cross section data that GMS displays on the screen can be controlled through the ''Cross Sections'' tab of the ''Display Options'' dialog. This dialog is opened by right-clicking on the Cross Sections [[File:Cross Section Folder.svg|16 px]] entry in the [[GMS:Project Explorer|Project Explorer]] and selecting the '''Display Options''' command. It can also be accessed from the ''Display'' menu or the '''Display Options''' [[File:Display Options Macro.svg|16 px]] macro. The following describes the display options available for the cross sections. |
|
| |
|
| The properties of all cross section data that GMS displays on the screen can be controlled through the Cross Sections tab of the Display Options dialog. This dialog is opened by right clicking on the [[Image:CrossSectionFolder.GIF]] Cross Sections entry in the [[GMS:Project Explorer|Project Explorer]] and selecting the Display Options command. It can also be accessed from the from the Display menu or the [[Image:dispopts.gif]] Display Options macro. The following table describes the display options available for the cross sections. | | * ''Interior edge removal'' – By default, the lines representing the intersection of the cross section with the faces of the cells or elements are displayed on the cross section. These lines can be hidden by selecting the Interior edge removal option. |
| | * ''Cross section edges'' – Displays the lines that make up the cross section. |
| | :The color of the cross section edges can be adjusted according to the following options: |
| | # Auto – Draws the material color if faces are not displayed. Uses black or white if the faces are displayed. The thickness and the line style can still be adjusted in the ''Line Properties'' dialog accessed through the button next to ''Cross section edges''. |
| | # Specified – Uses the color specified next to ''Cross section edges''. |
| | # Material – Displays the material color of the cell with the thickness and line style options of the ''Line Properties'' dialog. |
| | * ''Cross section faces'' – Displays each cross section as a set of filled polygons. The fill color corresponds to the material color of the corresponding geometry |
| | * ''Contours'' – Displays contours on the cross sections using the active scalar dataset. Available for both 3D Grid and UGrid. Clicking the '''Options''' button to the right opens the [[GMS:Contour Options|''Dataset Contour Options'']] dialog for setting the specifics of the contour display. |
| | * ''Vectors'' – Displays vectors on the cross sections using the active vector dataset when the cross sections are displayed. Available for both 3D Grid and UGrid. Clicking the '''Options''' button to the right opens the [[GMS:Vectors|''Vector Options'']] dialog for setting the specifics of the vector display. Clicking the button to the left opens a ''Color'' dialog for setting the color of the vectors. |
| | * ''Flow trace'' – If the Flow trace item is selected, a flow trace image is texture mapped to each cross section using the active vector dataset when flow trace option is used with the ''Animation'' wizard. Available for both 3D Grid and UGrid. |
|
| |
|
| {| class="wikitable"
| | ==Convert Cross Section to Coverage== |
| ! width="125" | Display Option !! Description
| | Cross sections can be converted to coverages by right-clicking on the cross section in the Project Explorer and selecting the '''Convert To Coverage''' command. The outer boundary of each material zone is converted into arcs and polygons are automatically built. |
| |-
| | |
| | Interior edge removal || By default, the lines representing the intersection of the cross section with the faces of the cells or elements are displayed on the cross section. These lines can be hidden by selecting the Interior edge removal option.
| | {| border=0 |
| |-
| | |- |
| | Cross section edges || If this option is on, the lines that make up the cross section are displayed.
| | | [[image:x2cov_1.png|thumb|none|300 px|Converting a cross section to a coverage]] |
| |-
| | | [[image:x2cov_2.png|thumb|none|300 px|The resulting coverage from the cross section]] |
| | Cross section faces || If this option is on, then the cross section will be displayed as a set of filled polygons. | |
| |- | |
| | Contours || If the Contours item is selected, contours are displayed on the cross sections using the active scalar data set. | |
| |- | |
| | Vectors || If the Vectors item is selected, vectors are displayed on the cross sections using the active vector data set when the cross sections are displayed. | |
| |- | |
| | Flow trace || If the Flow trace item is selected, a flow trace image is texture mapped to each cross section using the active vector data set when flow trace option is used with the Animation wizard. | |
| |} | | |} |
| | |
| | When this command is executed, a prompt will ask to select where the new coverage(s) should be created in the project explorer. If wanting to have the materials from the cross section assigned to the appropriate polygons in the coverage then select an appropriate conceptual model. The conceptual model must support the assignment of materials to polygons (MODFLOW, SEEP2D/UTEXAS, FEMWATER). |
| | |
| | ===Coordinate Transformation=== |
| | The coordinates of points from the cross section are transformed into the XY plane. The x coordinates are calculated relative to zero where zero is defined as one end of the cross section. Currently the end of the cross section that is designated as zero is the end with the minimum Y coordinate.<!--If the cross section is horizontal then the end of the cross section with the minimum X is used.--> |
| | |
| | The x coordinates are calculated by finding the distance of the point from the end of the cross section that was set as zero. The Y coordinates are calculated by subtracting the minimum z value of the cross section from the z value of the point (y = z - z_min). |
| | |
| | ===Limitations=== |
| | * The cross section must be vertical. |
| | * The cross section must be a single panel (when viewing the cross section in plan view it appears as a single line segment). |
| | |
|
| |
|
| {{Navbox GMS}} | | {{Navbox GMS}} |
| | [[Category:Solids|C]] |
Cross sections—also referred to as fence diagrams—are flat surfaces used to visualize the subsurface. GMS has different types of cross section objects:
Solid Cross Sections
Solid cross sections can be created by "slicing" through a set of solids using the Create Cross Section tool. This can be done at any angle and the slicing can be done using a multi-segment polyline. Solid cross sections can be converted to a conceptual model. This is useful if there is a solid model of an embankment to analyze using UTEXAS.
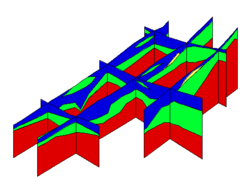
Example of fence diagrams created using solids
Borehole Cross Sections
Borehole cross sections are quite different than solid, 3D grid, and 3D mesh cross sections. See the page on Borehole Cross Sections.
3D Grid Cross Sections
3D grid cross sections are created similar to solid cross sections. Datasets are automatically interpolated from the 3D grid to the cross sections and contours can be displayed on the cross sections.
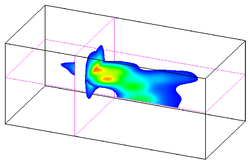
Two cross sections cut through a 3D grid
3D Mesh Cross Sections
3D mesh cross sections are created similar to solid cross sections. Datasets are automatically interpolated from the 3D mesh to the cross sections and contours can be displayed on the cross sections.
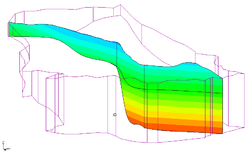
Multi-panel cross section cut through a 3D mesh
Cross Section Options
When cross sections are created from a mesh or a grid, values of the active scalar and vector datasets are interpolated to the cross sections. Whenever a new dataset is chosen as the active dataset for the mesh, the data values are re-interpolated to the cross sections.
The properties of all cross section data that GMS displays on the screen can be controlled through the Cross Sections tab of the Display Options dialog. This dialog is opened by right-clicking on the Cross Sections  entry in the Project Explorer and selecting the Display Options command. It can also be accessed from the Display menu or the Display Options
  macro. The following describes the display options available for the cross sections.
- Interior edge removal – By default, the lines representing the intersection of the cross section with the faces of the cells or elements are displayed on the cross section. These lines can be hidden by selecting the Interior edge removal option.
- Cross section edges – Displays the lines that make up the cross section.
- The color of the cross section edges can be adjusted according to the following options:
- Auto – Draws the material color if faces are not displayed. Uses black or white if the faces are displayed. The thickness and the line style can still be adjusted in the Line Properties dialog accessed through the button next to Cross section edges.
- Specified – Uses the color specified next to Cross section edges.
- Material – Displays the material color of the cell with the thickness and line style options of the Line Properties dialog.
- Cross section faces – Displays each cross section as a set of filled polygons. The fill color corresponds to the material color of the corresponding geometry
- Contours – Displays contours on the cross sections using the active scalar dataset. Available for both 3D Grid and UGrid. Clicking the Options button to the right opens the Dataset Contour Options dialog for setting the specifics of the contour display.
- Vectors – Displays vectors on the cross sections using the active vector dataset when the cross sections are displayed. Available for both 3D Grid and UGrid. Clicking the Options button to the right opens the Vector Options dialog for setting the specifics of the vector display. Clicking the button to the left opens a Color dialog for setting the color of the vectors.
- Flow trace – If the Flow trace item is selected, a flow trace image is texture mapped to each cross section using the active vector dataset when flow trace option is used with the Animation wizard. Available for both 3D Grid and UGrid.
Convert Cross Section to Coverage
Cross sections can be converted to coverages by right-clicking on the cross section in the Project Explorer and selecting the Convert To Coverage command. The outer boundary of each material zone is converted into arcs and polygons are automatically built.
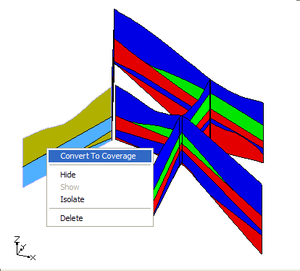 Converting a cross section to a coverage |
 The resulting coverage from the cross section |
When this command is executed, a prompt will ask to select where the new coverage(s) should be created in the project explorer. If wanting to have the materials from the cross section assigned to the appropriate polygons in the coverage then select an appropriate conceptual model. The conceptual model must support the assignment of materials to polygons (MODFLOW, SEEP2D/UTEXAS, FEMWATER).
Coordinate Transformation
The coordinates of points from the cross section are transformed into the XY plane. The x coordinates are calculated relative to zero where zero is defined as one end of the cross section. Currently the end of the cross section that is designated as zero is the end with the minimum Y coordinate.
The x coordinates are calculated by finding the distance of the point from the end of the cross section that was set as zero. The Y coordinates are calculated by subtracting the minimum z value of the cross section from the z value of the point (y = z - z_min).
Limitations
- The cross section must be vertical.
- The cross section must be a single panel (when viewing the cross section in plan view it appears as a single line segment).


