SMS:GIS Module Display Options
From XMS Wiki
(Redirected from SMS:GIS Display)
Jump to navigationJump to search
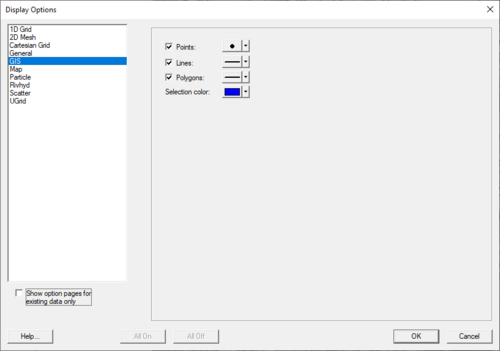
The properties of the GIS Module data SMS displays on the screen can be controlled through the Display Options dialog. The options are used with shapefiles that have been imported into the project. The available GIS Module Display Options include the following:
- Points – Opens the Point Attributes dialog where the diameter and color of points can be selected.
- Lines – Opens the Line Attributes dialog where the width and color of lines can be selected. Also allows selecting if lines will be solid or dashed.
- Polygons Opens the Line Attributes dialog where the width and color of polygon lines can be selected. Also allows selecting if lines will be solid or dashed.
- Select color Open the Color dialog where the color of selected options can be determined.
Related Topics
SMS Display Options | |
|---|---|
| Modules | Mesh Module • Cartesian Grid Module • 3D Cartesian Grid Module • Scatter Module • Map Module • GIS Module • Particle Module |
| Datasets | Contour Options • Vector Options |
SMS – Surface-water Modeling System | ||
|---|---|---|
| Modules: | 1D Grid • Cartesian Grid • Curvilinear Grid • GIS • Map • Mesh • Particle • Quadtree • Raster • Scatter • UGrid |  |
| General Models: | 3D Structure • FVCOM • Generic • PTM | |
| Coastal Models: | ADCIRC • BOUSS-2D • CGWAVE • CMS-Flow • CMS-Wave • GenCade • STWAVE • WAM | |
| Riverine/Estuarine Models: | AdH • HEC-RAS • HYDRO AS-2D • RMA2 • RMA4 • SRH-2D • TUFLOW • TUFLOW FV | |
| Aquaveo • SMS Tutorials • SMS Workflows | ||
