SMS:Highlights: Difference between revisions
From XMS Wiki
Jump to navigationJump to search
No edit summary |
No edit summary |
||
| (8 intermediate revisions by the same user not shown) | |||
| Line 17: | Line 17: | ||
{{SMS_at_a_glance_models|Heading====Models===|Link=[[SMS:SMS_Models|More Info...]]}} | {{SMS_at_a_glance_models|Heading====Models===|Link=[[SMS:SMS_Models|More Info...]]}} | ||
| Line 25: | Line 23: | ||
{{SMS_at_a_glance_contours|Heading====Contours===|Link=[[SMS:Contour Options|More Info...]]}} | {{SMS_at_a_glance_contours|Heading====Contours===|Link=[[SMS:Contour Options|More Info...]]}} | ||
{{SMS_at_a_glance_vectors|Heading====Vectors===|Link=[[SMS:Vector | {{SMS_at_a_glance_vectors|Heading====Vectors===|Link=[[SMS:Vector Display Options|More Info...]]}} | ||
{{SMS_at_a_glance_plots|Heading====Plots===|Link=[[SMS:Plot Window|More Info...]]}} | {{SMS_at_a_glance_plots|Heading====Plots===|Link=[[SMS:Plot Window|More Info...]]}} | ||
| Line 35: | Line 33: | ||
==Data Tools== | ==Data Tools== | ||
{{SMS_at_a_glance_data_calculator|Heading====Data Calculator===|Link=[[SMS:Data Calculator|More Info...]]}} | {{SMS_at_a_glance_data_calculator|Heading====Data Calculator===|Link=[[SMS:Data Calculator|More Info...]]}} | ||
{{SMS_at_a_glance_data_transform|Heading====Data Transform===|Link=[[SMS:Data Transform|More Info...]]}} | {{SMS_at_a_glance_data_transform|Heading====Data Transform===|Link=[[SMS:Data Transform|More Info...]]}} | ||
{{ | {{SMS_at_a_glance_projections|Heading====Projections===|Link=[[Projections|More Info...]]}} | ||
{{SMS_at_a_glance_import_wizard|Heading====Import Wizard===|Link=[[SMS:File Import Wizard|More Info...]]}} | {{SMS_at_a_glance_import_wizard|Heading====Import Wizard===|Link=[[SMS:File Import Wizard|More Info...]]}} | ||
| Line 59: | Line 55: | ||
{{Template:Navbox SMS}} | {{Template:Navbox SMS}} | ||
[[Category:SMS General Information|H]] | |||
Latest revision as of 14:46, 20 September 2017
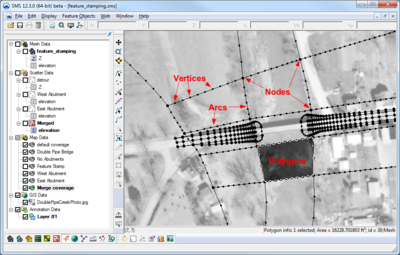
Layout
- The project explorer shows data currently loaded in project
- Menu bar depends upon the active module and model
- Edit window show x, y, z, scalar, and vector values
- Edit window values can be edited in some circumstances
- The status window on the bottom of the graphics window shows coordinates and selection information
- Help information is displayed at the bottom of the SMS screen
- Several toolbars are used in SMS. The dynamic tools change based upon the current module.
Modules
- Data is divided into modules based upon the data type
- There is always one active module
- The menus and toolbars are based upon the active module
- The current module may be selected in module bar or by selecting an object in the Project Explorer
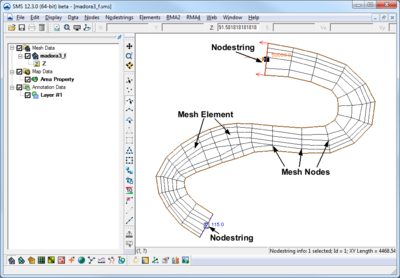
Mesh Module
- Used to create, edit, and visualize mesh data
- Also referred to as unstructured grids or finite element meshes
- Meshes defined by nodes and elements
- Several element types are supported
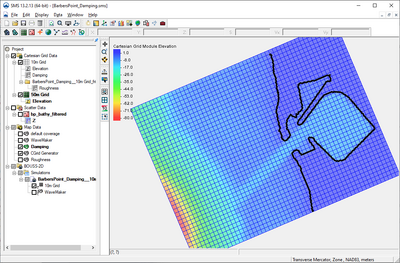
Cartesian Grid Module
- Used to create, edit, and visualize rectilinear grids
- Datasets can have values at cells, corners, and midsides
- Can use cell-centered or mesh-centered grids
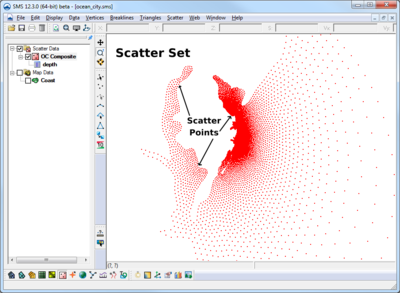
Scatter Module
- Used to create, edit, and visualize triangulated irregular networks
- DEMs can be read in and converted to TINs
- Filter scatter sets to eliminate redundant data
- Datasets can be interpolated to other modules (meshes, grids, etc)
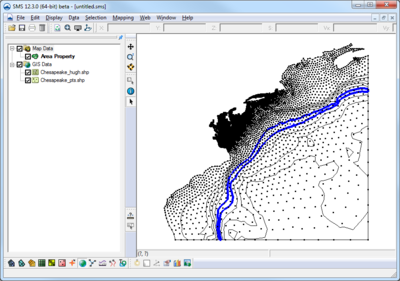
GIS Module
- Open and visualize GIS data
- Supports ESRI and MapInfo formats
- Uses Mapobjects for ESRI files if available to use ArcGIS visualization options
- Open and visualize raster data
- GIS data can be converted to feature data (map module)
- Convert raster to TIN (scatter set)
- Interpolate data from raster to TINs /2D mesh/2D grid
Map Module/Conceptual Models
- Create and edit GIS like data
- Used to create conceptual models as well as data for other purposes
- Conceptual model is a geometry (mesh/grid) independent representation of the numeric model domain and/or boundary conditions
- Conceptual models can be converted to model geometry and boundary conditions
- Conceptual model makes it easier to create, edit, and alter models
Particle Module
- Visualize particle/path data
- Supports PTM model which computes particle positions through time based upon hydrodynamics and wave effects
Models
- SMS is a graphical interface that supports many numeric models
- The models were developed by government or private entities
- Hydrodynamic models compute water surface elevations and velocities (ADCIRC, SRH-2D, TUFLOW, etc.)
- Wave models compute wave characteristics (BOUSS2D, CGWAVE, etc.)
- GenCade is a shoreline model that predicts how the coastline will move based upon long term wave information
- PTM tracks particle positions through time based upon hydrodynamics and wave effects
Visualization Tools
Contours
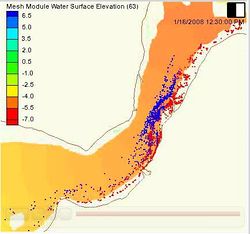
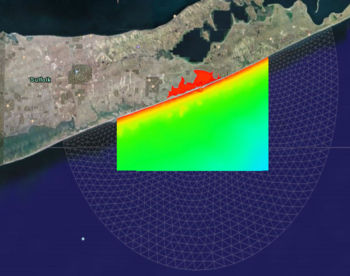
- Visualize scalar datasets
- Linear, color filled or both at the same time
- Variable level of transparency
- Full control of ranges and colors
- Precision control for labels and legends
Vectors
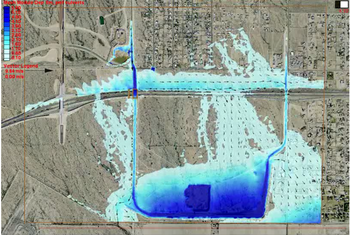
- Visualize vector datasets as arrows
- Constant size or vary by magnitude
- Show just a range of magnitudes
- Color by magnitude
Plots
- 2D plots to visualize results and compare to measured values
- Profile plots view scalar data along an arc
- Time series plots view scalar, vector, or flux (flow rate) data at a point or across an arc
- Several kinds of plots can be used to compare model results with measured data
Functional Surfaces
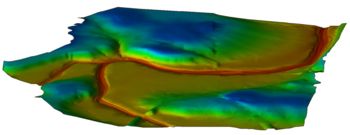
- Surface with elevation based upon scalar dataset values
- Very useful for wave models and models with large change in water surface elevation
- Elevations can be exaggerated to better visualize dataset variations
- Surfaces can have a solid color or use color filled contours
- Transparency can be used to allow see through surfaces
Animations
- Several types of AVI animations (film loops) can be generated by SMS
- Transient data animation shows model changes through time (contours, vectors, etc.)
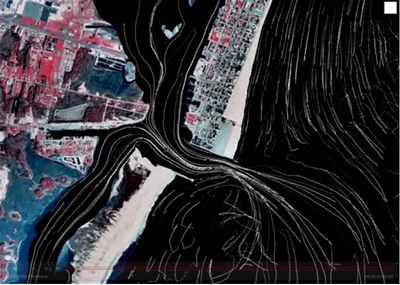
- Flow trace uses vector data to generate flow paths through the geometry
- Drogue plots use user specified starting locations and show how the particles would flow through a vector field
- Multiple view animations show the data while transitioning between different views
- Plot window animations show plots changing through time
Data Tools
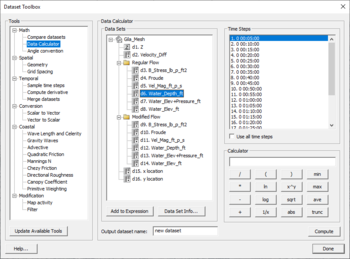
Data Calculator
- Performs mathematical calculations on scalar datasets
- Calculations can include any number of scalar datasets and user supplied numbers
- Useful for computing derived values such as Froude numbers
- Useful for comparing scalar datasets
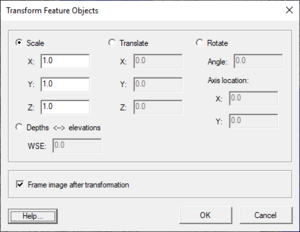
Data Transform
- Data can be scaled, translated, rotated
- Depths/elevations can be converted back and forth
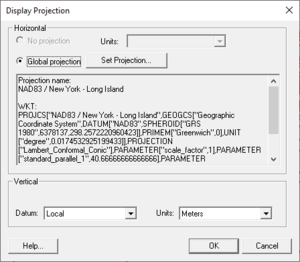
Projections
- Associate a projection with data
- Ability to work with global, local, and no projection
- Convert data from one projection to another
- Projections include Geographic, UTM, and State Plane coordinate systems
- Reproject data on the fly align multiple projections
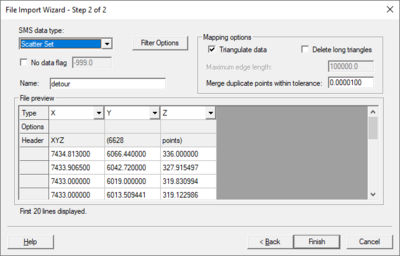
Import Wizard
- Read columnar ASCII data into SMS
- Columns can be fixed width or delimited by specific characters
- Data can be read as mesh, scatter, or map data
Miscellaneous Tools
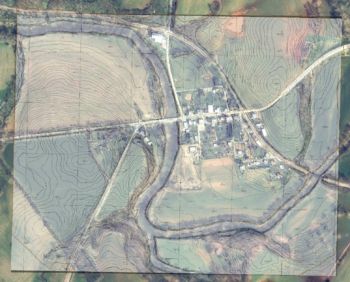
Image Support
- Multiple images can be read/viewed at the same time (tiled or overlay)
- Independent transparency specified for each image
- Images can be loaded from web services as either static or dynamic images
- Images can be draped over mesh or scatter data
- Many image formats are supported including JPG, TIFF, PNG, MrSID, and ECW
- Local images can be geo-referenced to view images along with other data
- Image pyramids can be created for very large images
CAD Support
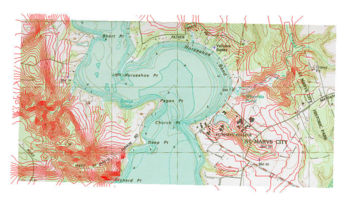
- AutoCAD DXF, DWG, and DGN files can be read into SMS
- Supports up to AutoCAD version 2019
- CAD data is displayed in 3D
- CAD data can be converted to map or scatter data
Export Options
- Graphics window can be copied to the clipboard
- Current view can be exported in KML format for visualization in Google Earth
Meshing Options
- Generating a quality finite element mesh is central to using many SMS models
- Conceptual models make generating meshes easier
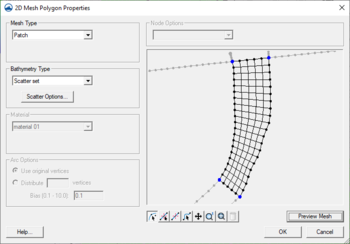
- Polygons can use a variety of meshing options to generate triangular or quadrilateral elements
- Polygons can be assigned bathymetry and material information that will be transferred with the mesh
- Constant paving density and Scalar paving density generates elements with sizes based upon a size dataset allowing for smooth transitions and a large range of element sizes and is particularly useful for coastal and wave models.
- For the constant option, the element target size is specified for each polygon.
- For the spatially varying (scalar paving) option, the target element size is based upon a size dataset on a TIN allowing for smooth transitions and a large range of element sizes.
- Datasets for scalar paving density can be user defined or generated using the Data Calculator, the Dataset Toolbox, or LTEA (linear truncation error analysis) (ADCIRC)
Import from Web
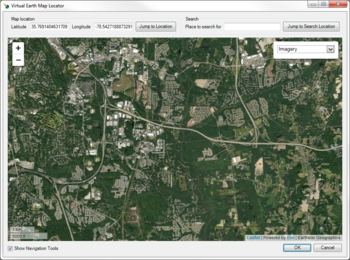
- Easy to use navigation tool that allows choosing a model location
- Image data is downloaded from USGS TerraServer
- Image options include aerial photos, topographic charts, and urban (higher resolution color)
Zonal Classification
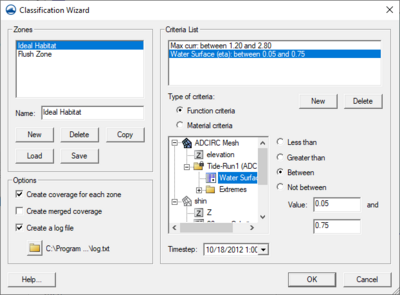
- Generate a map coverage identifying areas that meet specific requirements
- Requirements can be based upon dataset values such as less than a specific value or based upon materials in an area property coverage
SMS – Surface-water Modeling System | ||
|---|---|---|
| Modules: | 1D Grid • Cartesian Grid • Curvilinear Grid • GIS • Map • Mesh • Particle • Quadtree • Raster • Scatter • UGrid |  |
| General Models: | 3D Structure • FVCOM • Generic • PTM | |
| Coastal Models: | ADCIRC • BOUSS-2D • CGWAVE • CMS-Flow • CMS-Wave • GenCade • STWAVE • WAM | |
| Riverine/Estuarine Models: | AdH • HEC-RAS • HYDRO AS-2D • RMA2 • RMA4 • SRH-2D • TUFLOW • TUFLOW FV | |
| Aquaveo • SMS Tutorials • SMS Workflows | ||

