SMS:TUFLOW Coverages
TUFLOW models use several types of Feature coverages. Coverages are used in SMS to represent geometry and associated attributes as points, arcs, and polygons. Unlike some models used in SMS, TUFLOW uses coverage data as model inputs.
TUFLOW coverages can be associated with 2D Geometry Components and TUFLOW Simulations by creating links to the coverage in the component or simulation. The use of links allows multiple simulations or geometry components to share coverage data. Sharing data between simulations reduces required disk space for the simulation and makes it easier to update several simulations with the same changes.
In addition to the coverages listed below, TUFLOW models can use Area Property Coverages to define where to use specific material properties using polygons.
Grid Extents Coverage
A TUFLOW 2D Grid Extents coverage is used to create TUFLOW grids. TUFLOW grids are generated by creating and positioning a Cartesian Grid Frame and then right-clicking on the coverage and choosing Map→2D Grid.
Boundary Conditions Coverage
Boundary conditions are defined in TUFLOW with points, arcs, or polygons in a 1D–2D BCs and Links coverage. BC coverages can also be used to specify cell code (active/inactive) areas of the 2D model domain. The kinds of boundary conditions available depend upon whether it is applied to a point, arc or polygon.
Boundary conditions defined at points are 1D boundary conditions and must be placed at the same location as a 1D boundary node. (See Snapping Feature Objects) The boundary condition information is specified in the BC Node Attributes dialog (see 1D Boundary Conditions at Nodes).
Arcs can be used to define 2D Boundary conditions applied to the 2D domain. The BC attributes are specified in the BC Arc Attributes dialog (see 2D Boundary Conditions at Arcs).
Polygons can be used to define rainfall applied to 2D domains or to specify active/inactive information for 2D domains. The BC Polygon Attributes dialog specifies the type of information stored with the polygons (see 2D Boundary Conditions at Polygons).
1D/2D Connections Coverage
1D/2D connections are used with the 2D boundary condition coverage to link 2D and 1D domains.
Two types of arcs can be created in a 1D–2D Connection coverage: 1D/2D connection arcs (CN) and Flow vs. Head Connection arcs (SC).
1D–2D Connection arcs are written to a 2d_bc layer file for TUFLOW input (see 2d_bc_layers in the TUFLOW documentation). One end of the connection arcs must end at the same location as a 1D Flow/2D Water Level Connection (HX) in a TUFLOW boundary conditions coverage. The other end of the connection arc must end at the same location as a network node in a TUFLOW network coverage.
The coverage has a couple unique commands that appear when right-clicking on the 1D–2D Connections coverage. The commands are:
- Properties
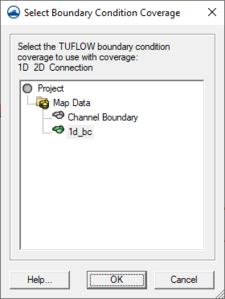
- Brings ups a Select Boundary Condition Coverage dialog where a boundary condition coverage can be assigned to the connection coverage.
- Clean Connections
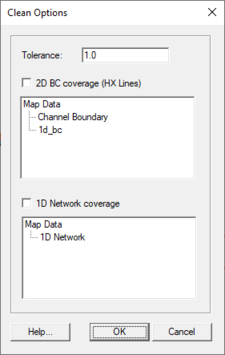
- Opens a Clean Options dialog.
TUFLOW Clean Options
This dialog makes sure that connections arcs end at HX boundaries and the HX boundaries have nodes at the connection endpoints. The dialog has the following options:
- Tolerance – Determines the tolerance level SMS will use in determining if the connection arcs end at the HX boundaries.
- 2D BC coverage – Sets the boundary condition coverage that will provide the HX boundary. The coverage is selected in the tree below.
- 1D Network coverage – Sets the network coverage to be used. The coverage is selected in the tree below.
1D Cross Section Coverage
Cross section coverages are used to define open channel cross section data for 1D networks. Cross section geometry is generally extracted from a TIN and may be edited by hand if desired.
Cross sections are created by creating arcs in a cross section coverage. SMS can automatically create cross section arcs from a 1D network.
After cross section arcs are created, the elevations for the arc can be extracted from a scatter set (TIN) by right-clicking on the coverage and selecting Extract from Scatter from the menu. This will extract the cross-section data from the active dataset on the active scatter set. Values are extracted at each triangle edge in the scatter set and each node or vertex on the cross section arc.
After cross sections have been created, the materials from an area property coverage may be mapped to the cross-sections. This is done by right-clicking on the coverage and selecting, Map Materials from Area Property Coverage.
Individual cross sections may be viewed and edited by double-clicking on an arc, or by selecting an arc and choosing Feature Objects | Attributes. This will bring up the Cross Section Attributes dialog.
All the cross-sections in the coverage are stored in a cross section database. The cross section database may be opened by right-clicking on the coverage and selecting Properties (see Editing Cross Sections).
1D Network Coverage
1D domains are made up of a network of channels and nodes. Channels represent the conveyance of the flowpaths and nodes represent the storage of inundated areas (TUFLOW Users Manual). Channels are created using arcs and the arc endpoints are the nodes.
There are a variety of channel types including open channels, weirs, and culverts (pipe networks). The channel also has a variety of attributes depending upon the channel type. The channel type and attributes are defined in the Channel Attributes dialog.
There are two types of nodes generic nodes, and inlets. Generic nodes can be used to specify storage and can be used to set channel invert elevations. Inlet nodes are used to get flows from a 2D domain into a 1D pipe network below the 2D domain. The node type and attributes are defined in the Network Node Attributes dialog.
The TUFLOW documentation sections 4.5.1.3: Connecting Pits and Nodes to 2D Domains and 4.5.3: 1d_nwk Attributes list some new TUFLOW features that SMS now supports. SMS's Network Node Attributes dialog has several new additions to the Create Connection to 2D Domain (SX) section. These new options allow controlling elevations at the connections, how many cells are connected, and the method for selection of additional cells (Grade or Sag). Each option correlates fairly directly to a TUFLOW field and some are labeled as such to make look-up easy.
2D/2D Links Coverage
Any number of grids of varying sizes and/or orientations may be used in TUFLOW. A 2D/2D Links Coverage is used to setup TUFLOW to use multiple 2D domains.
See TUFLOW Linking 2D Domains for more information.
2D Flow Constriction Shape Coverage
A 2D Flow Constriction Shape coverage is used to define flow constrictions in TUFLOW. These are used to model hydraulic structures or other sources of additional losses in TUFLOW. Flow constrictions are of two categories: standard (non-layered) and layered flow constrictions. Layered flow constrictions can be used to model situations where flow has multiple pathways at different elevations. Examples would include flow under a bridge and over the bridge deck as well as a pipeline (typically large box culverts to model as 2D) crossing a waterway. The standard (non-layered) flow constrictions can model box culverts, floating bridge decks, bridges, or apply additional form losses to an area (due to submodel scale features). Flow constrictions can be created for arcs or polygons.
Note that this coverage is different from the older (and outdated) 2D Flow Constriction coverage, which is still supported.
Overview
Standard (non-layered) Flow Constrictions
Flow constrictions introduce additional losses and/or reduced flow areas through an area of the domain. Flow constrictions can be used for large box culverts, bridges, or floating bridge decks. Flow constriction properties include invert elevations (optional), low chord (obvert) elevations for structures, blockage information, manning n values, and form loss coefficients.
Layered Flow Constrictions
Here is the description from the TUFLOW manual:
Four layers (not GIS layers!) are represented, with the bottom three layers each having their own attributes. The top, fourth, layer assumes the flow is unimpeded (eg. flow over the top of a bridge). Within the same shape, the invert of the bed, and thickness of each layer can vary in 3D. Each layer is assigned its own percentage blockage and form loss coefficient. For example, the layers of a bridge structure would be along the following lines.
- Layer 1: Beneath the bridge deck. Might be 5% blocked due to the bridge piers and have a small form loss for the energy losses associated with the piers.
- Layer 2: The bridge deck. This would be 100% blocked and the form loss coefficient would increase due to the additional energy losses associated with flow surcharging the deck.
- Layer 3: The bridge rails. These might be anything from 100% blocked (solid concrete rails) to 10% blocked (very open rails). Some form losses would be specified depending on the type of rails.
- Layer 4: Flow over the top of the rails – flow assumed to be unimpeded.
Layered FCs function by adjusting the flow width of the 2D cell so as to represent the combination of blockages of the four layers, and by accumulating the form losses. When the flow is only within Layer 1, only the attributes of Layer 1 are applied. As the water level rises into Layer 2, the influence of the Layer 2 attributes increase as the water continues to rise. Similarly for Layer 3 and Layer 4.
The cell side flow width is calculated by summing the flow areas of each layer (including the effects of layer blockages), and dividing by the water depth. The form losses are applied as follows:
- If the water is entirely within Layer 1, the Layer 1 FLC is applied.
- If the water level has reached Layer 2, the value applied is the Layer 1 FLC plus a fraction of the Layer 2 FLC based on the depth of water within Layer 2. For example, if Layer 1 FLC is 0.1 and Layer 2 is 0.5, and the water is 40% of the way up Layer 2, the FLC applied is 0.1 + 0.4*0.5 = 0.3.
- Similarly, if the water level is into Layer 3, the FLC is the Layer 1 FLC plus the Layer 2 FLC plus a fraction of the Layer 3 FLC.
- Once the water level is above Layer 3, ie. is into Layer 4, the FLC is held constant at the sum of the FLCs for Layers 1 to 3.
--TUFLOW Manual 2008-08
Varying Elevations Within Flow Constriction
Flow constrictions can be specified as polygons or arcs (along a line). For a flow constriction defined by a polygon, some values may be varied within the polygon by using arc and point attributes. For standard flow constrictions, the invert and low chord (obvert) elevations can be modified within the polygon. For layered flow constrictions, the layer elevations, blockage, form losses, and invert elevations can vary within the polygon.
In order to distribute these vertices for the flow constriction, TUFLOW creates a TIN from the specified data points and interpolates these values through the flow constriction. The flow constriction dialog has several attributes which influence how this TIN is generated and applied. The final elevations for the grid can be verified by reading the "zsh_zpt_check.mif" file into the GIS coverage. The final information about standard flow constrictions can be verified using check files. The "fcsh_uvpt_check.mif" for standard flow constrictions and "lfcsh_uvpt_check.mif" for layered flow constrictions (see SMS:TUFLOW Check Files).
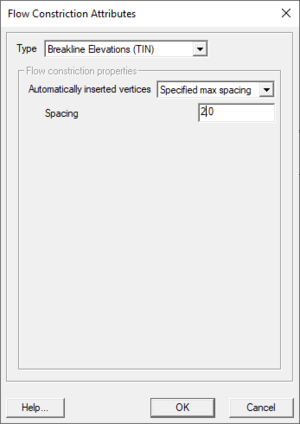
Arcs on the perimeter or within a polygon flow constriction can be used to spatially distribute the properties above. To use an arc for elevations, specify it to be the "Breakline Elevations" type in the arc properties dialog. Elevations can be specified at nodes at the end of arcs but not on intermediate vertices. Therefore, in order to represent curved flow constrictions or changes in slope, it's necessary to convert vertices to nodes to create multiple arc segments. These arcs will become breaklines in the TIN generated by TUFLOW. Points within a polygon can also be used to specify elevations and will become an individual point in the generated TIN.
It is important to keep in mind when using flow constrictions that elevation data comes from a combination of the cell elevations, elevations specified with the flow constriction itself, and elevations assigned to perimeter nodes or interior points depending upon the whether each kind of data exists and the options chosen for the flow constriction.
Creating Flow Constrictions
To create a flow constriction for an arc or polygon:
- Create a 2D Flow Constriction Shape coverage and an arc/polygon in the coverage. Note that the old 2D Flow Constriction coverage is also still available, and is different from the one being created.
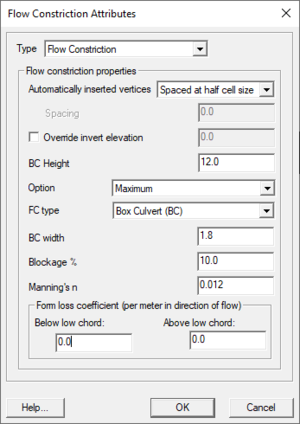
- Double-click on the arc/polygon and change the type to Flow Constriction or Layered Flow Constriction and set the options according to the guidelines below.
Flow Constriction Options
- Width –
- Override Invert Elevation – Unless overriden, TUFLOW will use the 2D cell elevations for the invert elevations of the flow constriction.
- Option – This controls when invert elevations will be applied. If the choice is Minimum, the new invert elevations will be used only if they are lower than the original cell elevations. Similarly, if the choice is Maximum the new elevations will only be used if they are higher than the original cell elevations. If All is chosen, the new elevations will be used regardless if the elevations are higher or lower.
TUFLOW has the option to merge elevations at the perimeter of the flow constriction with the existing elevations that exist in the perimeter cells to make the transition between the elevations smooth. The Default option (polygons only) will merge elevations of perimeter points that do not have a specified elevation value but apply specified elevations at points. The All option (arcs only) will ignore specified elevations at perimeter points and merge the values with the perimeter points. The No Merge option will ignore existing cell elevations and the elevations will come from specified node values if they exist otherwise they will come from the elevations specified for the flow constriction.
Breakline Elevations
- Automatically Inserted Vertices - Used to affect how TUFLOW generates the TIN to use to interpolate elevation data within the flow constriction. Additional vertices can be useful to provide a better triangulation and more smooth transitions between values. The default is for TUFLOW to generate additional vertices so that the final spacing is not more than half the cell size.
Layered Flow Constriction Options
- Invert Elevation Offset – This will offset the invert elevations whether they are specified or are the original cell elevations.
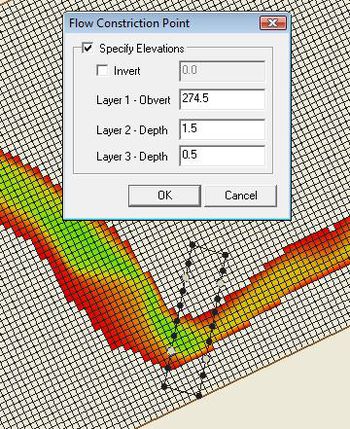
- Layer 1 Low chord – The low chord (obvert) represents the top of layer 1. For a bridge this is the low chord of the bridge deck.
- Layer 2 and 3 Depths – This represent the depth of the layers after layer 1. The obvert of each layer is determined on a cell by cell level from the layer1 low chord/obvert elevation.
- Blockage % – This represents the percentage of the flow width lost due to large piers, railings, or other flow impediments. If half of the flow is blocked, the percentage lost is 50%.
- Form Loss – The form loss is the ratio of the dynamic head that is lost in the structure. This value can be larger than 1.0 since all of the energy does not have to come from the velocity component. This can be estimated from experience or by comparing with other numeric codes.
Non-Layered Flow Constriction Options
- FC Type – Flow Constriction Type. Options are:
- General – Does not include allowances for any vertical walls or friction from underside of deck.
- BC – Box Culvert
- BD – Bridge Deck
- FD – Floating Deck
- Low chord (obvert)/BC Height/Bridge Deck Depth – The usage of this field changes depending on FC Type (above). Enter a sufficiently high value (eg. 99999) if there is no obvert constriction.
- General or BD – Low chord/Obvert (soffit) of constriction in m above datum.
- BC – The height of the box culvert.
- FD – Floating depth (m) of the deck (ie. depth below the water line).
- BC Width – The width of one BC culvert barrel in metres. For example, if there are 10 by 1.8m wide culverts, enter a value of 1.8.
- Blockage % – The percentage blockage of the cells. For example, if 40 is entered (ie. 40%), the cell sides are reduced in flow width by 40%, ie. is set to 0.6 times the full flow width.
- Manning's – According to TUFLOW's docs:
For box culverts (BC), the Manning’s n of the culverts (typically 0.011 to 0.015) should be specified. This value prevails over any other bed resistance values irrespective of where in the *.tgc file they occur (the exception is if another FC BC object overrides this one). If set to less than 0.001, a default value of 0.013 is used.
For bridge decks (BD), can be used to introduce additional flow resistance once the upstream water level reaches the bridge deck low chord/obvert (or soffit). For floating decks (FD) this is always the case as the deck soffit is permanently submerged. The additional flow resistance is modelled as an increase in bed resistance by increasing the wetted perimeter at the cell mid-side by a factor equal to (2.*Bed_n)/FC_n. For example, if the FC Manning’s n and the bed Manning’s n values are the same, the wetted perimeter is doubled, thereby reducing the conveyance and increasing the resistance to flow. To be used as a calibration parameter to fine-tune the energy losses across a bridge or floating structure.
Ignored for General FC Types.
- Form Loss Coefficient – Form loss coefficient to be applied above and below the FC low chord/obvert. Used for modeling fine-scale “micro” contraction/expansion losses not picked up by the change in the 2D domain’s velocity patterns (eg. bridge pier losses, vena-contracta losses, 3rd (vertical) dimension etc). The effect of these fields changes between arcs and polygons, thick and thin lines, as detailed in the TUFLOW docs (section 4.7.2).
Node Options
All nodes have the option of overriding the invert height at their location. Beyond this, the fields available in the node attributes dialog change based on whether the node is inside (or on the edge) of a Layered Flow Constriction Polygon. If so, the node properties will resemble that of the layered polygon's with layers 1–3. Otherwise only the Low chord (obvert) can be modified.
As with polygons, the Low chord can actually mean different things depending on the settings of FC Type and other factors. This is determined by the polygon the node is on or inside of.
Example: Arched Bridge
Because it's hard to glean applicable knowledge from a dry description of dialogs, here's an example of how they might be used. We're going to create an arched bridge using a Flow Constriction polygon and Breakline Elevations.
- Start by creating the Flow Constriction Shape coverage.
- Next create 4 connected arcs in a rectangle for the polygon for the bridge. Go to Feature Objects | Build polygons to create the polygon.
- Select the polygon and enter its attributes dialog. Fill the values as follows:
- Click the Select Feature Arc tool and select both arcs along the sides of the bridge. Turn both these arcs into breakline elevations. Right-click and select Attributes....
- Set the Type to Breakline Elevations (TIN)
- Set Automatically insert vertices to "Spaced at half cell size".
- Next create some nodes along these arcs to set different low chord elevations at each one to create the arch. With the arcs still selected, right-click and select Redistribute Vertices.... In the dialog, choose Number of Segments for the Specify field and enter 9 as the number of segments. Click OK. This splits up the lines so that there are a total of 8 vertices on each, which will be converted to nodes.
- Choose the Select Feature Vertex option and select all the vertices on the bridge sides (either with a drag-select or by holding shift). Right-click and choose Convert to Nodes.
- Now it's time to set the node data. Choose the Select Feature Point tool. For each node along the sides of the bridge, enter its attributes dialog (right-click with it selected and choose Node Attributes...) and insert the data below. Multi-select nodes with the SHIFT key and edit their attributes simultaneously. Since both sides of the bridge will be the same, and the data below is symmetrical on each end of the bridge, select 4 nodes at once to set their values to save time.
| Node | L1 Low chord | L2 Depth | L3 Depth |
|---|---|---|---|
| Node1 | 271 | 3 | 0.5 |
| Node2 | 273 | 2 | 0.5 |
| Node3 | 274.5 | 1.5 | 0.5 |
| Node4 | 275.5 | 1.25 | 0.5 |
| Node5 | 276 | 1 | 0.5 |
| Node6 | 276 | 1 | 0.5 |
| Node7 | 275.5 | 1.25 | 0.5 |
| Node8 | 274.5 | 1.5 | 0.5 |
| Node9 | 273 | 2 | 0.5 |
| Node10 | 271 | 3 | 0.5 |
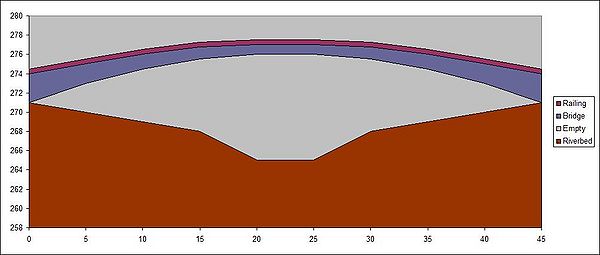
There is now an arched bridge that will look something like the image below from the side. There is an added 25% blockage under the bridge to cover things like pillars holding the bridge up, vegetation, fairy-tale trolls hiding underneath, and so on. Layer 2 is the bridge itself, which provides 100% blockage because our bridge is solid concrete and does not allow any water to flow through that section. Above that, the railing gives 25% blockage but otherwise lets water through just fine. And above that? Nothing—any water that rises above the railing of the bridge is completely unrestricted.
The varying width of Layer 2 allows us to create a bridge that is thickest on the ends of the bridge and thin in the center. Our Layer 1 blockage takes support pillars into account, and TUFLOW will automatically determine how much of layers 1, 2 and 3 are affecting the water at any given time and calculate the flow constriction from there.
2D Spatial Attributes Coverage
Spatially varied attributes can be defined using the 2D spatial attributes coverage. The values for the attributes are assigned to polygons. TUFLOW assigns the values from the polygons to the cells that exist within the polygon.
The two available spatial attributes are initial water levels and weir factors.
Assigning spatially varied initial water levels may be necessary to ensure that water bodies have water in them initially.
2D Z Lines (Advanced) Coverage
The 2D Z Lines (Advanced) Coverage is similar to the geometry modification coverage which allows modifying terrain along an arc or arcs, but has additional options. With the 2D Z Lines (Advanced) coverage, modify geometry through time to simulate levee failures or other changes to elevation data within the model run. These changes are set up start when a "trigger" is activated such as at a specific time during the simulation or when water depth exceeds a certain amount. An example application is a levee collapsing when flood water overtops it.
- Make sure the coverage is in the Geometry Component(s) that is to be applied to the modification.
TUFLOW also supports the features described above using polygon ZShapes. However, SMS does not support polygon ZShapes using these advanced features (such as triggers) at this time. If necessary to create static modifications to terrain using polygons, use the 2D Z Lines/Polygons (Simple) Coverage.
The 2D Z Lines (Advanced) Coverage
The 2D Z Lines (Advanced) coverage is available under the models/TUFLOW folder. ZShape data is stored in a feature arc's attributes. The Z values of the feature arc's points determine its Z, not the Z of the arc itself (exceptions to this are explained in the Arc Properties Dialog section below).
ZShapes are split into two main categories, Static ZShapes and Variable ZShapes. Static ZShapes are simple terrain modifications that do not change over time. They can be used to create a levee, pit, sand bar, dam, etc. Variable ZShapes have a trigger that causes them to raise or lower the terrain during the simulation. Often a variable ZShape is combined with a static one to provide raised terrain for the trigger to modify. This is necessary because a variable z shape cannot raise the same area it intends to lower when its trigger activates -- it needs the terrain to already be there and cannot create it itself, only modify once its trigger activates.
Arc Properties Dialog
Arcs in a 2D Z Lines/Polygons (Advanced) coverage store ZShape data only if they are told to "override Z values". Otherwise they are not exported for TUFLOW's use. To reach the properties dialog,right-click on an arc and choose "Attributes...". Below is an explanation of the zshape options.
- Override Z Values: ZShape data is only stored and exported if this checkbox is enabled. It tells TUFLOW to override the current terrain Z values with the new values from the arc.
- Thickness: Arcs can be Thin Lines, Thick Lines, or Wide Lines. Thin lines have a width of 0, thick lines have a thickness less than or equal to 1.5 times the 2D cell size, and wide lines are any width larger than that. Thin lines follow some special rules that affect other options in the dialog, such as Option and Trigger Type.
- Option: The ZShape Options are All, Add, Min, Max, and Offset. Offset is only available for variable thin line Z Shapes, which cannot use the Add, Min or Max options. Add is unavailable for any variable Z Shape.
- Offset is not listed by the same name in the TUFLOW documentation and is an alias in SMS for not specifying "NO MERGE". This causes the points of the arc to not be written, and the Z of the arc is determined by the Offset field.
- Offset: Raises the entire arc by this amount. Negative values are appropriate.
- When offset is specified as the Option for variable thin lines, this field specifies the height to adjust terrain to (instead of adjusting it up or down by this amount) when triggered.
- For all other variable arcs, this the the amount to adjust the terrain by when the trigger activates.
- Use Trigger: Toggles the arc between being a static zshape and a variable zshape. Variable z shapes use triggers to change terrain when a specific event occurs. All variable Z Shapes have the Duration option to span the change over a certain period of time. Other options will change with the Trigger Type.
- Trigger Type: The type of event that will trigger the Z modification.
- Specified time: Triggers at a specific time during the simulation, measured in hours.
- Water level at point: Uses a Trigger Point to measure water level, and triggers when the water level reaches or exceeds the value in the Water level field.
- Water level difference: Uses two trigger points. Triggers when the difference between water levels measured at both points exceeds the value in Water level difference. A difference in either direction is treated the same in TUFLOW, and there is no need for negative numbers.
- Thin line water level: Similar to Water level at point, but for thin lines. Does not use a trigger point, instead measuring the water levels on either side of the thin line.
- Thin line water level difference: Triggers when the difference between water levels on either side of the thin line reaches or exceeds the value in Water level difference.
- Point1 and Point2: Both point selection boxes list the trigger points available in the coverage. These fields are only enabled for trigger types that use them.
- Specified time, Water level, Water level difference: These fields become available based on the trigger type selected.
- Duration: If set to 0, changes are instantaneous once triggered. Otherwise the change will be interpolated over this many hours.
- Restore Z Shape: This option can be used to have TUFLOW restore the original elevations at a specified time.
- Repeat restoration: The z-shape will be restored indefinitely.
- Restore interval: The time (hrs) between when the variable z-shape is finished and when to start restoring the points back to their original values.
- Restore period: The time (hrs) needed to restore the points back to their original values.
Trigger Points
Trigger points are used by the Water level at point and Water level difference trigger types. Simply create a feature point and enter its attributes dialog to create a trigger point.
Trigger Point Dialog
The trigger point dialog is used to turn a feature point into a ZShape trigger point. Enabling the Specify Trigger checkbox and giving the point a name will cause it to appear in the Point1 and Point2 selection boxes in the arc attributes dialog for use as a trigger point. If renaming a trigger point that is being used by triggers, or delete it by unchecking Specify Trigger, SMS will notify that there are one or more arcs/polygons being updated with the new change.
2D Z Lines/Polygons (Simple) Coverage
These coverages are used as geometry modifications and force grid elevation values using arcs or polygons. This can be useful to ensure ridge or gully lines are represented in the model, simulate a proposed levy, or to simulate a proposed fill/excavation scenario.
It is possible to only have the elevations assigned from a feature object if the feature elevation is higher or lower (user specified) than the existing elevations in the grid. This is controlled in the 2D Z Lines/Polygons (Simple) Coverage Properties dialog (right-click on the coverage and choose Properties). The options specified in the coverage properties dialog apply to any geometry modification arcs and polygons within the coverage. If wanting to use multiple settings within a simulation, there must be multiple 2D z line/polygon (simple) coverages.
Z Values
The z values determine how the elevations in the coverage are used to modify the existing model elevations. The options are:
- All Zpts (default) – The z values from all of the arcs/polygons are used.
- Min – The z values from the arcs/polygons will only overwrite the existing elevations if the elevations are lower.
- Max – The z values from the arcs/polygons will only overwrite the existing elevations if the elevations are higher.
- Add – The z value becomes the existing elevation plus the z value from the arc/polygon (which may be negative).
Thick Arcs
If this option is not selected, the z values of the arc will be applied to the nearest elevation locations in each cell that the arc passes through. Otherwise, the arc elevations will be applied to every elevation location in each cell that the arc passes through.
Make sure the coverage is in the Geometry Component(s) that is to be applied to the modification.
Points
Points are ignored in the geometry modification coverage.
Arcs
Only the elevations at the nodes (endpoints) are used to set the grid elevations. Vertex (intermediate) elevations are ignored. Cell elevations along the arc will be interpolated linearly based on distance from the endpoint elevation. If wanting to specify elevations at vertices on an arc, convert the arc vertices to nodes to create multiple arcs joined end to end.
Polygons
To set the elevation for polygons double-click on the polygon and enter the elevation in the Polygon Elevation dialog. This elevation will be applied to all cells within the polygon. This dialog can also be accessed by right-clicking on a polygon and selecting Attributes for the right-click menu.
- File:TUFLOW Z Value.jpgTUFLOW Polygon Elevation dialog
Clip Region Read TIN Z pts Coverage
Using a coverage to specify a clip region, makes it so only elevations within coverage polygons are changed by a TIN dragged under a 2D geometry component. This is particularly useful for clipping out a TIN due to unwanted or irregular triangulation around the periphery, especially for secondary TINs of proposed developments lying within the primary TIN.
To use this coverage, create a coverage with one or more polygons. Only areas within polygons and within the TIN boundaries will have elevations assigned. There must be a scatter set in the 2D Geometry Components. Then drag and drop this coverage under the scatter tree item, under the 2D Geometry Components.
Water Level Lines Coverage
Water level line coverages define the locations where 1D solutions will be written as 2D output. TUFLOW creates water level points along the water level lines. The water level lines in conjunction with the water level points guide TUFLOW on how to represent the 1D flow in the 2D domain.
Arcs are the only objects used in the water level lines coverage. The only attribute in the water level lines coverage is the minimum distance between water level points. This is used by TUFLOW to generate the water level points along the arcs. To change this attribute, double-click on an arc or right-click and select Attributes from the right-click menu. This brings up the Water Level Arc Attributes dialog.
For more information about how TUFLOW uses water level lines to generate 2D flows see TUFLOW Water Level Points Coverage.
Water Level Points Coverage
Water level points are used in conjunction with water level lines to guide TUFLOW on creating 2D output for 1D networks (see TUFLOW Water Level Lines Coverage).
Water level points store a material value. This material value along with the z location of each point is used by TUFLOW to better approximate 2D flow along a water level line. TUFLOW performs a parallel channel analysis so that flow rates reported in the 2D output vary based upon the depth and roughness of a channel. Areas that are more rough and shallow than other areas will have a smaller flow rate than other areas along the same water level line.
The material value for each point can be mapped from an area property coverage by right-clicking on the coverage tree item and selecting Materials for Area Coverage. By default the elevation of each point is based upon the neighboring cross-section information.
Creating the Water Level Points Coverage
The initial water level points coverage data is created by TUFLOW during a run. Once a run has been completed, the data can be read from the check file that starts with the simulation name and ends with _WLLp_check.mif (see TUFLOW check files). Open this file from SMS and select TUFLOW WLL Points from the combo-box that comes up. This coverage now can be included in simulations to provide additional guidance to TUFLOW in distributing 1D flows.
Related Topics
SMS – Surface-water Modeling System | ||
|---|---|---|
| Modules: | 1D Grid • Cartesian Grid • Curvilinear Grid • GIS • Map • Mesh • Particle • Quadtree • Raster • Scatter • UGrid |  |
| General Models: | 3D Structure • FVCOM • Generic • PTM | |
| Coastal Models: | ADCIRC • BOUSS-2D • CGWAVE • CMS-Flow • CMS-Wave • GenCade • STWAVE • WAM | |
| Riverine/Estuarine Models: | AdH • HEC-RAS • HYDRO AS-2D • RMA2 • RMA4 • SRH-2D • TUFLOW • TUFLOW FV | |
| Aquaveo • SMS Tutorials • SMS Workflows | ||
