GMS:MODPATH Display Options
From XMS Wiki
(diff) ← Older revision | Latest revision (diff) | Newer revision → (diff)
| MODPATH | |
|---|---|
| Pre-processing | |
| MODPATH Commands | |
| MODPATH Particle Tracking | |
| MODPATH Particle Sets | |
| MODPATH Zone Codes | |
| Post-processing | |
| MODPATH Display Options | |
| Exporting Pathlines | |
| Tutorials | |
| MODPATH Tutorials | |
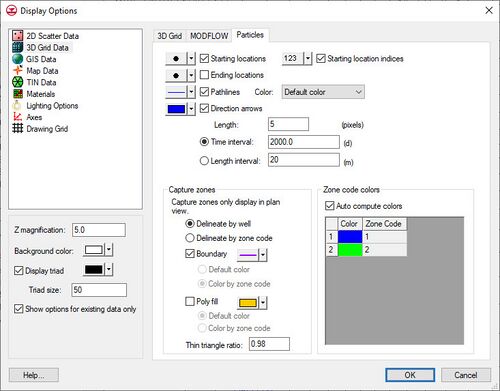
A set of display options unique to the MODPATH input data and MODPATH solutions is provided in GMS. These options are accessed through the Display Options command in the MODPATH menu. This command is only available if a MODFLOW simulation exists. This command brings up the Particles tab of the 3D Grid Display Options dialog. The following table describes the display options available for the MODPATH model. This table also describes the options found under the Particles tab in the UGrid display options. When it's under the UGrid display options, these options control the display of mod-PATH3DU data and results.
| Display Option | Description |
|---|---|
| Starting locations | Displays the starting locations for particles. The symbol style, color, and size can also be adjusted. |
| Starting location indices | Displays the starting location indices for the particles. Starting locations must also be turned on for the indices to display. The font style, color, and size can also be adjusted. |
| Ending locations | Displays the ending locations for particles. The symbol style, color, and size can also be adjusted. |
| Pathlines | Displays the pathlines. The pathline style and color can be adjusted. The pathline color can be set to the default color, or the color corresponding to the starting, ending, or cell zone codes of the pathlines. The starting and ending code options cause the pathlines to be colored according to the zone codes at the start or end of the pathlines, respectively. The "Cell zone code" option causes the pathline to change color as it passes through cells with different zone codes. |
| Direction arrows | Displays direction arrows along the pathlines. The size of the arrow heads can be set by specifying the Length in pixels. The arrows are displayed along the pathline at an interval corresponding to either the Time interval or the Length interval specified. |
| Zone codes | Colors can be associated with zone codes. If the Auto compute colors option is selected, GMS will automatically pick colors to go with each unique zone code. Otherwise, the user can specify the color desired to associate with each zone code. These colors are used if the Pathline Color option is set to "Starting code", "Ending code", or "Cell zone code". These colors are also used if any of the options in the Capture zones section are set to Color by zone code. |
| Capture zones | GMS groups pathlines together into capture zones. A polygon representing the outer boundary of the pathlines is found. The polygons can be outlined or filled using the options under Boundary and Poly fill. The following options are available relating to the capture zones:
|
| [hide]GMS – Groundwater Modeling System | ||
|---|---|---|
| Modules: | 2D Grid • 2D Mesh • 2D Scatter Point • 3D Grid • 3D Mesh • 3D Scatter Point • Boreholes • GIS • Map • Solid • TINs • UGrids | |
| Models: | FEFLOW • FEMWATER • HydroGeoSphere • MODAEM • MODFLOW • MODPATH • mod-PATH3DU • MT3DMS • MT3D-USGS • PEST • PHT3D • RT3D • SEAM3D • SEAWAT • SEEP2D • T-PROGS • ZONEBUDGET | |
| Aquaveo | ||
