GMS:Map to Modules
Feature objects in the Map module can be converted to geometries in other modules using the following commands.
Contents
Arc → Cross Sections
The default method for generating cross sections through solids, 3D meshes, or 3D grids it to interactively enter a line or a polyline in the Graphics Window while the Make Cross Section tool is active (Solid module, 3D Grid module, 3D Mesh module). This line is then projected perpendicular to the screen (parallel to the viewers viewing angle) and is intersected with the 3D objects to generate the cross section. In some cases, it is useful to precisely locate the cross section. Furthermore, it is often necessary to repeatedly generate a cross section at the same location. In such cases, the Arcs → Cross Sections command can be used to precisely control the location of a cross section.
When the Arcs → Cross Sections command is selected, the Arcs → Cross Sections dialog appears. The top part of the dialog is used to specify which of the arcs are to be used to create the cross sections. Either all of the arcs are used or only the selected arcs. Since cross sections can be cut through any 3D object, the items in the lower section of the dialog are used to designate which of the 3D objects will be used to cut the cross sections. If one of the types listed does not currently exist, the corresponding item is dimmed.
When the OK button is selected, a cross section is constructed for each of the designated arcs. As is the case when the Make Cross Section tool is used, the cross sections are constructed by projecting the arcs parallel to the viewing angle. For example, to create vertical cross sections, the image should be in plan view prior to selecting the Arcs → Cross Sections command.
Map → TIN
The Map → TIN command creates a TIN using each polygon in the coverage. Vertices and nodes in the polygons are triangulated using the triangulation algorithm. The algorithm assumes that each of the vertices being triangulated is unique in the xy plane.
Map to 2D Mesh
Once a set of feature objects has been created for a SEEP2D or a FEMWATER conceptual model, the Map → 2D Mesh command can be used to generate a 2D finite element mesh from the objects. The Map → 2D Mesh command creates a 2D mesh on the interior of all of the polygons in the current coverage. The figure below shows a cross section of a dam built using the feature objects in the Map module. The second figure shows a 2D mesh created from the polygons.
Map to 2D Grid
The Map → 2D Grid command is used to construct a 2D grid using the feature objects in a 2D grid coverage. When the Map → 2D Grid command is selected, the Create Finite Difference Grid dialog appears. If a grid frame has been defined, the size and location of the grid frame are used to initialize the fields in the Create Grid dialog. In most cases, these values will not need to be changed and the user can simply select the OK button to create the grid. If a grid frame has not been defined, the size and location of the grid are initialized so that the grid just surrounds the currently defined feature objects. If desired, the grid dimensions can be edited prior to selecting the OK button to create the grid.
If one or more refine points are defined in the conceptual model, the number of rows and columns in the grid will be automatically determined when the grid is created. Thus, these fields cannot be edited by the user and will be dimmed. If refine points are not defined, the user must enter the number of rows and columns.
Map to 3D Grid
Once the feature object coverages defining a conceptual model have been completely defined, the conceptual model is ready to be converted to a numerical model. The first step in this conversion process is to create a grid using the Map → 3D Grid command. Typically, the Grid Frame command is used prior to this command to define the location and dimensions of the grid.
When the Map → 3D Grid command is selected, the Create Finite Difference Grid dialog appears. If a grid frame has been defined, the size and location of the grid frame are used to initialize the fields in the Create Grid dialog. In most cases, these values will not need to be changed and the user can simply select the OK button to create the grid. If a grid frame has not been defined, the size and location of the grid are initialized so that the grid just surrounds the currently defined conceptual model. Once again, in most cases, no changes will need to be made and the user can typically immediately select the OK button to create the grid.
If one or more refine points are defined in the conceptual model, the number of rows and columns in the grid will be automatically determined when the grid is created. Thus, these fields cannot be edited by the user and will be dimmed. If refine points are not defined, the number of rows and columns must be entered.
Refine Points
Refine attributes are assigned to points or nodes and are used to automatically increase the grid density around a point when the grid is constructed. Although refine attributes may be associated with any point or node, they are usually assigned in conjunction with wells.
Map to 2D Scatter Points
The Map → 2D Scatter Points command creates a scatter point set from the points and nodes and vertices of the current coverage. The process is different for observation coverages and non-observation coverages.
- Non-observation Coverages – With non-observation coverages, a single elevation dataset is created for the 2D scatter points representing the Z location of all the points, nodes and vertices.
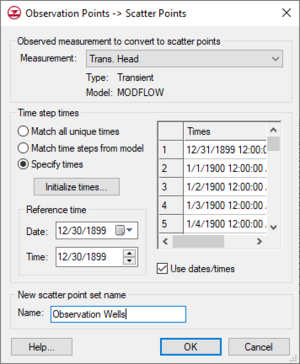
- Observation Coverages – With observation coverages, the Observation Points → Scatter Points dialog appears. This dialog allows creating a dataset for the 2D scatter points from one of the measurements associated with the observation points.
- Measurement – A dataset is created for the 2D scatter points from the measurement selected in the dialog. The model associated with the selected measurement (if any) is shown, along with whether the measurement is steady state or transient.
- Time Step Times – This section of the dialog is only available if the selected measurement is transient. It allows the user to define the number of time steps, and the time step times to be created for the scatter point dataset.
- Match all unique times – The Match all unique times option gets the set of unique times from the XY series of all the observation points. This is the union of all the times. If some XY series use dates/times and others don’t, this option won’t be available. Otherwise, the times in the spreadsheet will be displayed as either dates/times or relative times depending on the XY series. The spreadsheet will not be editable. The Use dates/times toggle will be unavailable but set according to whether the observation point XY series use dates/times or not. The Reference time section will be unavailable, but if the XY series use dates/times, the minimum time will be used as the reference time for the scatter point dataset.
- Match time steps from model – The Match time steps from model option will only be available if the measurement is associated with a model, and the model is transient. If so, this will be the default choice and GMS will get the times to display in the spreadsheet from the stress period and time step info for the model. The spreadsheet will not be editable. The Use dates/times toggle will be unavailable but set according to whether the model uses dates/times or not. The Reference time section will be unavailable, but if the model uses dates/times, the model reference time will be used as the reference time.
- Specify times – The spreadsheet of times will be editable with this option. The user can then copy and paste times from another program such as a spreasheet. Also, the Initialize Times button becomes available to bring up a dialog that can be used to create times at a specified interval. If the user selects the Use dates/times toggle, the Reference time section will become available and the times in the spreadsheets will be displayed as dates/times.
Map to 3D Scatter Points
The Map → 3D Scatter Points command was introduced in GMS version 8.3. This command works exactly like the Map → 2D Scatter Points command except that 3D scatter points are created. One use of the Map → 3D Scatter Points command is to create scatter points from map data that can then be converted into MODPATH starting locations.
| GMS – Groundwater Modeling System | ||
|---|---|---|
| Modules: | 2D Grid • 2D Mesh • 2D Scatter Point • 3D Grid • 3D Mesh • 3D Scatter Point • Boreholes • GIS • Map • Solid • TINs • UGrids | |
| Models: | FEFLOW • FEMWATER • HydroGeoSphere • MODAEM • MODFLOW • MODPATH • mod-PATH3DU • MT3DMS • MT3D-USGS • PEST • PHT3D • RT3D • SEAM3D • SEAWAT • SEEP2D • T-PROGS • ZONEBUDGET | |
| Aquaveo | ||


