WMS:CE-QUAL-W2 Layer Editor: Difference between revisions
No edit summary |
No edit summary |
||
| Line 1: | Line 1: | ||
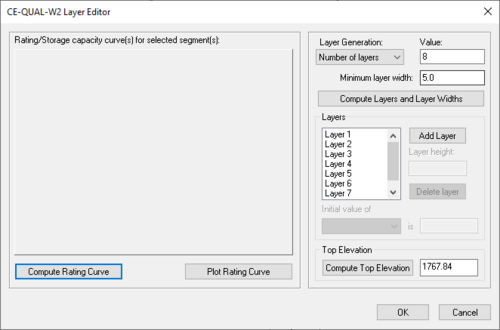
The layer editor is used for generating a storage capacity curve for a CE-QUAL-W2 application. The curve is computed from selected segment(s) of a representative waterbody and is generated by selecting the '''Compute | The layer editor is used for generating a storage capacity curve for a CE-QUAL-W2 application. The curve is computed from selected segment(s) of a representative waterbody and is generated by selecting the '''Compute Rating Curve''' button. Generation of the curve may take some time, especially where several segments have been selected. | ||
The '''Plot | The '''Plot Rating Curve''' button produces a separate image of the storage capacity curve. This image has several options which can be displayed by right clicking the mouse over the image. | ||
The '''Compute Top Elevation''' button will give the top elevation of the TIN in the ''Top elevation'' text box. It should be noted that this is not necessarily the top elevation of the waterbody. If the top elevation of the waterbody is desired then it should be manually input into the ''Top elevation'' text box. | The '''Compute Top Elevation''' button will give the top elevation of the TIN in the ''Top elevation'' text box. It should be noted that this is not necessarily the top elevation of the waterbody. If the top elevation of the waterbody is desired then it should be manually input into the ''Top elevation'' text box. | ||
Revision as of 15:05, 6 October 2017
The layer editor is used for generating a storage capacity curve for a CE-QUAL-W2 application. The curve is computed from selected segment(s) of a representative waterbody and is generated by selecting the Compute Rating Curve button. Generation of the curve may take some time, especially where several segments have been selected.
The Plot Rating Curve button produces a separate image of the storage capacity curve. This image has several options which can be displayed by right clicking the mouse over the image.
The Compute Top Elevation button will give the top elevation of the TIN in the Top elevation text box. It should be noted that this is not necessarily the top elevation of the waterbody. If the top elevation of the waterbody is desired then it should be manually input into the Top elevation text box.
The Layer Generation pulldown box gives two options for the number of layers in the bathymetry file. If wanting to prescribe the number of layers, the Number of layers option should appear in the box and the desired number of layers entered in the text box titled value. If wanting a certain layer height, the Layer heights option should be selected with the desired value for layer heights entered in the Value text box. Selecting the Compute button will compute the number of layers and/or layer heights for the waterbody. The layers will then appear in the large text box for viewing. These can be edited accordingly by using the Add Layer and Delete Layer button. Individual layer heights are shown in the Layer height text box.
Selecting the Calculate Widths button will calculate the widths of all selected segments.
Related Topics
WMS – Watershed Modeling System | ||
|---|---|---|
| Modules: | Terrain Data • Drainage • Map • Hydrologic Modeling • River • GIS • 2D Grid • 2D Scatter |  |
| Models: | CE-QUAL-W2 • GSSHA • HEC-1 • HEC-HMS • HEC-RAS • HSPF • MODRAT • NSS • OC Hydrograph • OC Rational • Rational • River Tools • Storm Drain • SMPDBK • SWMM • TR-20 • TR-55 | |
| Toolbars: | Modules • Macros • Units • Digitize • Static Tools • Dynamic Tools • Drawing • Get Data Tools | |
| Aquaveo | ||
