GMS:Plot Wizard: Difference between revisions
From XMS Wiki
Jump to navigationJump to search
No edit summary |
|||
| Line 47: | Line 47: | ||
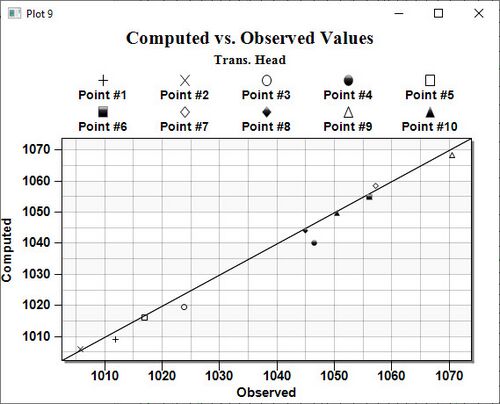
====Computed vs. Observed Troubleshooting==== | ====Computed vs. Observed Troubleshooting==== | ||
If a plot will not generate or does not display significant data, it's possible that the conditions for the plot have not been set up correctly. To get a meaningful plot, take the following into account: | If a plot will not generate or does not display significant data, it's possible that the conditions for the plot have not been set up correctly. To get a meaningful plot, take the following into account: | ||
* This plot requires an observation coverage with feature points included that have observation data from the field. | * This plot requires an observation coverage with feature points included that have observation data from the field. If there is more than one observation coverage, ensure the correct observation coverage is selected on step 2 of the ''Plot Wizard''. | ||
* This plot requires a simulation with calculated data of the same type of data as the observation coverage (head, for example). If the simulation does not have solution datasets, then this plot will not have significant results. | * This plot requires a simulation with calculated data of the same type of data as the observation coverage (head, for example). If the simulation does not have solution datasets, then this plot will not have significant results. | ||
* The dataset desired for visualization should be selected in the Project Explorer. If the active item in the Project Explorer is not a dataset that can be plotted, then the plot may not display any information even if viable datasets are present in the project. | * The dataset desired for visualization should be selected in the Project Explorer. If the active item in the Project Explorer is not a dataset that can be plotted, then the plot may not display any information even if viable datasets are present in the project. | ||
| Line 72: | Line 72: | ||
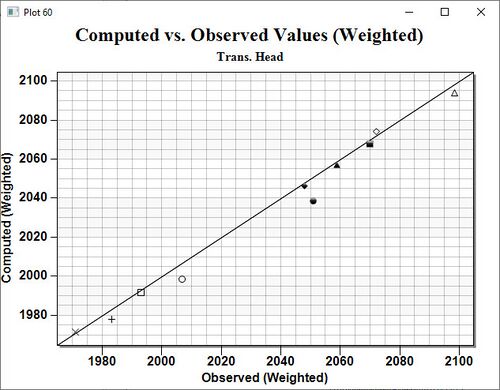
====Computed vs. Observed Plot (Weighted) Troubleshooting==== | ====Computed vs. Observed Plot (Weighted) Troubleshooting==== | ||
If a plot will not generate or does not display significant data, it's possible that the conditions for the plot have not been set up correctly. To get a meaningful plot, take the following into account: | If a plot will not generate or does not display significant data, it's possible that the conditions for the plot have not been set up correctly. To get a meaningful plot, take the following into account: | ||
* This plot requires an observation coverage with feature points included that have observation data from the field. | * This plot requires an observation coverage with feature points included that have observation data from the field. If there is more than one observation coverage, ensure the correct observation coverage is selected on step 2 of the ''Plot Wizard''. | ||
* This plot requires a simulation with calculated data of the same type of data as the observation coverage (head, for example). If the simulation does not have solution datasets, then this plot will not have significant results. | * This plot requires a simulation with calculated data of the same type of data as the observation coverage (head, for example). If the simulation does not have solution datasets, then this plot will not have significant results. | ||
* The dataset desired for visualization should be selected in the Project Explorer. If the active item in the Project Explorer is not a dataset that can be plotted, then the plot may not display any information even if viable datasets are present in the project. | * The dataset desired for visualization should be selected in the Project Explorer. If the active item in the Project Explorer is not a dataset that can be plotted, then the plot may not display any information even if viable datasets are present in the project. | ||
| Line 97: | Line 97: | ||
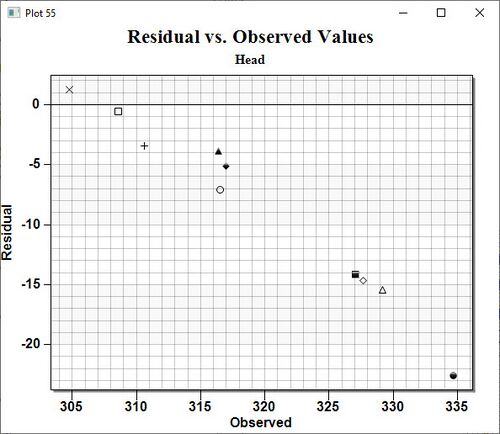
====Residual vs. Observed Troubleshooting==== | ====Residual vs. Observed Troubleshooting==== | ||
If a plot will not generate or does not display significant data, it's possible that the conditions for the plot have not been set up correctly. To get a meaningful plot, take the following into account: | If a plot will not generate or does not display significant data, it's possible that the conditions for the plot have not been set up correctly. To get a meaningful plot, take the following into account: | ||
* This plot requires an observation coverage with feature points included that have observation data from the field. | * This plot requires an observation coverage with feature points included that have observation data from the field. If there is more than one observation coverage, ensure the correct observation coverage is selected on step 2 of the ''Plot Wizard''. | ||
* This plot requires a simulation with calculated data of the same type of data as the observation coverage (head, for example). If the simulation does not have solution datasets, then this plot will not have significant results. | * This plot requires a simulation with calculated data of the same type of data as the observation coverage (head, for example). If the simulation does not have solution datasets, then this plot will not have significant results. | ||
* The dataset desired for visualization should be selected in the Project Explorer. If the active item in the Project Explorer is not a dataset that can be plotted, then the plot may not display any information even if viable datasets are present in the project. | * The dataset desired for visualization should be selected in the Project Explorer. If the active item in the Project Explorer is not a dataset that can be plotted, then the plot may not display any information even if viable datasets are present in the project. | ||
| Line 122: | Line 122: | ||
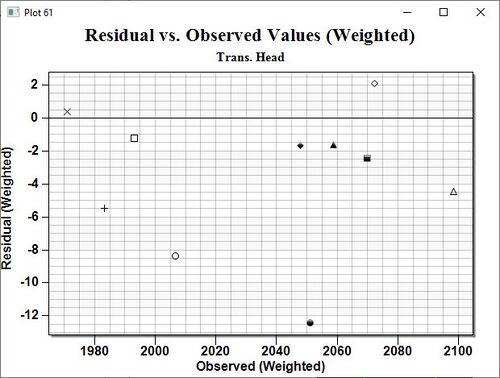
====Residual vs. Observed (Weighted) Troubleshooting==== | ====Residual vs. Observed (Weighted) Troubleshooting==== | ||
If a plot will not generate or does not display significant data, it's possible that the conditions for the plot have not been set up correctly. To get a meaningful plot, take the following into account: | If a plot will not generate or does not display significant data, it's possible that the conditions for the plot have not been set up correctly. To get a meaningful plot, take the following into account: | ||
* This plot requires an observation coverage with feature points included that have observation data from the field. | * This plot requires an observation coverage with feature points included that have observation data from the field. If there is more than one observation coverage, ensure the correct observation coverage is selected on step 2 of the ''Plot Wizard''. | ||
* This plot requires a simulation with calculated data of the same type of data as the observation coverage (head, for example). If the simulation does not have solution datasets, then this plot will not have significant results. | * This plot requires a simulation with calculated data of the same type of data as the observation coverage (head, for example). If the simulation does not have solution datasets, then this plot will not have significant results. | ||
* The dataset desired for visualization should be selected in the Project Explorer. If the active item in the Project Explorer is not a dataset that can be plotted, then the plot may not display any information even if viable datasets are present in the project. | * The dataset desired for visualization should be selected in the Project Explorer. If the active item in the Project Explorer is not a dataset that can be plotted, then the plot may not display any information even if viable datasets are present in the project. | ||
| Line 171: | Line 171: | ||
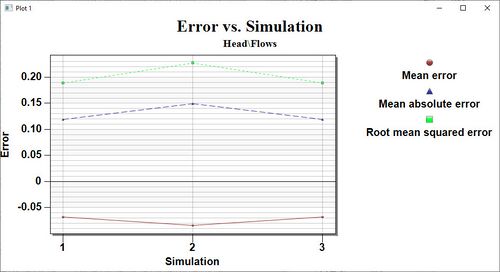
* This plot requires data from multiple simulation runs for comparing to each other. | * This plot requires data from multiple simulation runs for comparing to each other. | ||
: This data can be put in one project by using the '''Save As''' function to save the project with a new name before each MODFLOW simulation run. If the project isn't saved with a new name before each simulation run, the program will overwrite the former simulation results and the ''Error vs. Simulation'' plot will not have the desired comparison between simulation results. | : This data can be put in one project by using the '''Save As''' function to save the project with a new name before each MODFLOW simulation run. If the project isn't saved with a new name before each simulation run, the program will overwrite the former simulation results and the ''Error vs. Simulation'' plot will not have the desired comparison between simulation results. | ||
* This plot requires an observation coverage with feature points that include data from the field. This data is used to judge the accuracy of the each simulation run. | * This plot requires an observation coverage with feature points that include data from the field. This data is used to judge the accuracy of the each simulation run. If there is more than one observation coverage, ensure the correct observation coverage is selected on step 2 of the ''Plot Wizard''. | ||
* It's possible that the wrong geometry is active. Since simulation solutions are usually attached to geometries, it's important to select the geometry with the solutions to be compared. | * It's possible that the wrong geometry is active. Since simulation solutions are usually attached to geometries, it's important to select the geometry with the solutions to be compared. | ||
| Line 197: | Line 197: | ||
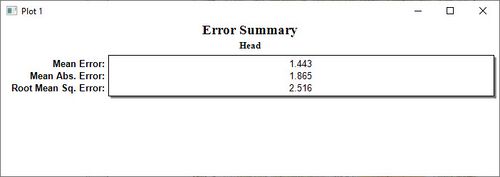
If a plot will not generate or does not display significant data, it's possible that the conditions for the plot have not been set up correctly. To get a meaningful plot, take the following into account: | If a plot will not generate or does not display significant data, it's possible that the conditions for the plot have not been set up correctly. To get a meaningful plot, take the following into account: | ||
* As noted above, this plot type cannot be used with MODFLOW beginning with version 8.0 of GMS. Ensure that the data to be visualized is not MODFLOW data. | * As noted above, this plot type cannot be used with MODFLOW beginning with version 8.0 of GMS. Ensure that the data to be visualized is not MODFLOW data. | ||
* This plot requires an observation coverage to compute error. Errors in the computed values are calculated based on observed values defined in an observation coverage. | * This plot requires an observation coverage to compute error. Errors in the computed values are calculated based on observed values defined in an observation coverage. If there is more than one observation coverage, ensure the correct observation coverage is selected on step 2 of the ''Plot Wizard''. | ||
* This plot requires a transient dataset to plot error against time. | * This plot requires a transient dataset to plot error against time. | ||
* Selecting the correct geometry/dataset is important for this plot. If significant results are not displaying, select the desired dataset in the Project Explorer. If it's unclear how to get the desired dataset to display, select different items in the Project Explorer until it's clear the desired dataset is active. | * Selecting the correct geometry/dataset is important for this plot. If significant results are not displaying, select the desired dataset in the Project Explorer. If it's unclear how to get the desired dataset to display, select different items in the Project Explorer until it's clear the desired dataset is active. | ||
| Line 222: | Line 222: | ||
If a plot will not generate or does not display significant data, it's possible that the conditions for the plot have not been set up correctly. To get a meaningful plot, take the following into account: | If a plot will not generate or does not display significant data, it's possible that the conditions for the plot have not been set up correctly. To get a meaningful plot, take the following into account: | ||
* As noted above, this plot type cannot be used with MODFLOW beginning with version 8.0 of GMS. Ensure that the data to be visualized is not MODFLOW data. | * As noted above, this plot type cannot be used with MODFLOW beginning with version 8.0 of GMS. Ensure that the data to be visualized is not MODFLOW data. | ||
* This plot requires an observation coverage to compute error. Errors in the computed values are calculated based on observed values defined in an observation coverage. | * This plot requires an observation coverage to compute error. Errors in the computed values are calculated based on observed values defined in an observation coverage. If there is more than one observation coverage, ensure the correct observation coverage is selected on step 2 of the ''Plot Wizard''. | ||
=== Time Series === | === Time Series === | ||
| Line 254: | Line 254: | ||
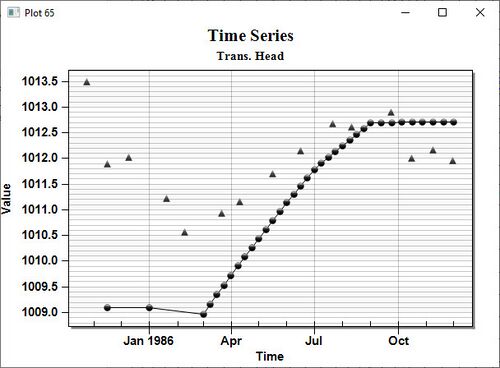
====Time Series Troubleshooting==== | ====Time Series Troubleshooting==== | ||
If a plot will not generate or does not display significant data, it's possible that the conditions for the plot have not been set up correctly. To get a meaningful plot, take the following into account: | If a plot will not generate or does not display significant data, it's possible that the conditions for the plot have not been set up correctly. To get a meaningful plot, take the following into account: | ||
* This plot requires an observation coverage with feature points included that have observation data from the field. | * This plot requires an observation coverage with feature points included that have observation data from the field. If there is more than one observation coverage, ensure the correct observation coverage is selected on step 2 of the ''Plot Wizard''. | ||
* A point from the observation coverage must be selected. This point can be selected in the Graphics Window or in the spreadsheet on the second page of the ''Plot Wizard''. If a point is not selected, the plot will not have significant results. | * A point from the observation coverage must be selected. This point can be selected in the Graphics Window or in the spreadsheet on the second page of the ''Plot Wizard''. If a point is not selected, the plot will not have significant results. | ||
* This plot requires a simulation with calculated transient data of the same type of data as the observation coverage (head, for example). If the simulation has not been run, then this plot will not have significant results. | * This plot requires a simulation with calculated transient data of the same type of data as the observation coverage (head, for example). If the simulation has not been run, then this plot will not have significant results. | ||
| Line 268: | Line 268: | ||
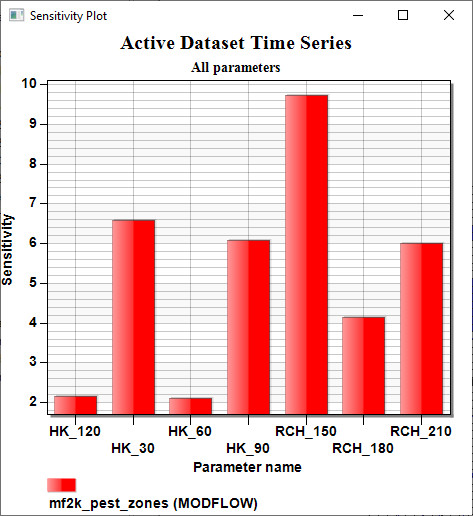
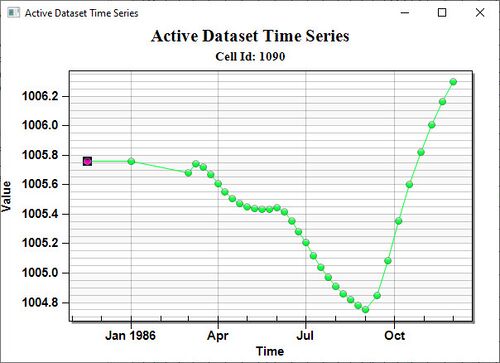
====Active Dataset Time Series Troubleshooting ==== | ====Active Dataset Time Series Troubleshooting ==== | ||
If a plot will not generate or does not display significant data, it's possible that the conditions for the plot have not been set up correctly. To get a meaningful plot, take the following into account: | If a plot will not generate or does not display significant data, it's possible that the conditions for the plot have not been set up correctly. To get a meaningful plot, take the following into account: | ||
* This plot needs a transient dataset interpolated to a mesh or a grid active in the Project Explorer and visible in the Graphics Window. This is | * This plot needs a transient dataset interpolated to a mesh or a grid active in the Project Explorer and visible in the Graphics Window. This is usually a dataset associated with a model solution. | ||
* A specific element of the geometry must be selected in order to generate meaningful data in this plot. Grids require that a grid cell be selected. Meshes require that a mesh node be selected. | * A specific element of the geometry must be selected in order to generate meaningful data in this plot. Grids require that a grid cell be selected. Meshes require that a mesh node be selected. | ||
| Line 321: | Line 321: | ||
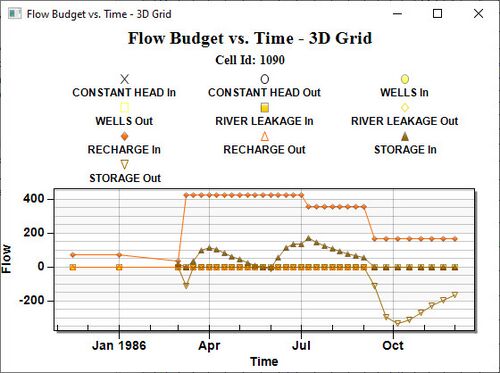
* This plot requires a grid of the appropriate type (3D Grid or UGrid). | * This plot requires a grid of the appropriate type (3D Grid or UGrid). | ||
* This plot requires a coverage with the appropriate attributes selected in the ''Coverage Setup'' dialog. | * This plot requires a coverage with the appropriate attributes selected in the ''Coverage Setup'' dialog. | ||
* This plot requires a transient MODFLOW simulation attached to the | * This plot requires a transient MODFLOW simulation attached to the geometry. | ||
* The data displayed depends on the active solution in the Project Explorer. Make sure the desired dataset is active in the Project Explorer for visualization. | * The data displayed depends on the active solution in the Project Explorer. Make sure the desired dataset is active in the Project Explorer for visualization. | ||
