WMS:Contour Options: Difference between revisions
No edit summary |
|||
| (24 intermediate revisions by 2 users not shown) | |||
| Line 1: | Line 1: | ||
[[File: | [[File:DEMcontouropts.jpg|thumb|500 px|Example of the ''Contour Options'' dialog.]] | ||
The options used to generate contours can be edited by selecting the ''Contour Options'' command in the ''Display'' menu. Each object that can be contoured (i.e. DEMs, TINs, Grids, Flood Plains) has its own set of contour options. This means | The options used to generate contours can be edited by selecting the ''Contour Options'' command in the ''Display'' menu. Each object that can be contoured (i.e. DEMs, TINs, Grids, Flood Plains) has its own set of contour options. This means there can be color filled contours for a DEM and linear contours on a TIN at the same time. The set of contour options being edited is determined by either the current module and/or the display options dialog from which the contour options are activated. For 2D grids there is set of contour options associated with dataset and the options of each dataset can be specified by right-clicking on the dataset folder from the ''Tree'' window, or by selecting an active dataset and choosing the '''Contour Options''' command or Macro. | ||
The items in the ''Contour Options'' dialog are as follows: | The items in the ''Contour Options'' dialog are as follows: | ||
| Line 16: | Line 16: | ||
====Specified Interval==== | ====Specified Interval==== | ||
With the ''Specified Interval'' option, the contour interval (5, 10, 20, etc.) is entered directly | With the ''Specified Interval'' option, the contour interval (5, 10, 20, etc.) is entered directly. | ||
====Specified Values==== | ====Specified Values==== | ||
The ''Specified Values'' option allows | The ''Specified Values'' option allows entering a list specific contour values. Contours are only generated at these values. | ||
If the ''Log Scale'' option is selected, WMS automatically assigns contour intervals as multiples of 10. Furthermore, if the color-fill or color ramp option is being used, the colors assigned to the contours are distributed in a logarithmic fashion, rather than linearly interpolated from the low to high values. | If the ''Log Scale'' option is selected, WMS automatically assigns contour intervals as multiples of 10. Furthermore, if the color-fill or color ramp option is being used, the colors assigned to the contours are distributed in a logarithmic fashion, rather than linearly interpolated from the low to high values. | ||
===Contour Method=== | ===Contour Method=== | ||
| Line 31: | Line 31: | ||
The default method is Normal linear contours and results in the contours being displayed as piece-wise linear strings. | The default method is Normal linear contours and results in the contours being displayed as piece-wise linear strings. | ||
[[File: | [[File:LinearContours.png|thumb|none|325 px]] | ||
'''Color Fill Between Contours''' | '''Color Fill Between Contours''' | ||
| Line 37: | Line 37: | ||
If the '''Color fill between contours''' button is selected, the region between adjacent contour lines is filled with a solid color. For DEMs each DEM grid cell is filled with the color corresponding to the elevation of that cell. For 2D Grids the color fill can be smoothed across cell boundaries (similar to the TINs method) or cell filled (similar to the DEM method). | If the '''Color fill between contours''' button is selected, the region between adjacent contour lines is filled with a solid color. For DEMs each DEM grid cell is filled with the color corresponding to the elevation of that cell. For 2D Grids the color fill can be smoothed across cell boundaries (similar to the TINs method) or cell filled (similar to the DEM method). | ||
[[File: | [[File:ColorFillContour.png||thumb|none|325 px]] | ||
A transparency value can be set for color filled contours so that an image or other data can be seen through the color filled contours. | A transparency value can be set for color filled contours so that an image or other data can be seen through the color filled contours. | ||
[[File: | [[File:Setting transparency in a color-filled contour.png|thumb|none|325 px]] | ||
'''Cubic Spline Contours''' | '''Cubic Spline Contours''' | ||
| Line 53: | Line 53: | ||
A legend displaying the range of colors and associated values can be turned on for the current set of contour options. The legend options include a title, font, size and position. By default the legend will be placed in the upper left of the graphics window, but can be positioned in the other three corners as well. This is important when displaying contours of more than one dataset at a time. | A legend displaying the range of colors and associated values can be turned on for the current set of contour options. The legend options include a title, font, size and position. By default the legend will be placed in the upper left of the graphics window, but can be positioned in the other three corners as well. This is important when displaying contours of more than one dataset at a time. | ||
[[File: | [[File:ContourLegendOpts.jpg|thumb|none|left|250 px|''Contour Legend Options'' dialog]] | ||
===Bold Contours=== | ===Bold Contours=== | ||
| Line 59: | Line 59: | ||
The ''Bold every...'' option can be used to display contours at selected intervals with a thicker line width. | The ''Bold every...'' option can be used to display contours at selected intervals with a thicker line width. | ||
[[File: | [[File:BoldContours.png|thumb|none|325 px]] | ||
===Contour Labels=== | ===Contour Labels=== | ||
| Line 70: | Line 70: | ||
* If the contour label option is selected in the ''Contour Options'' dialog, labels are automatically placed on the contours. | * If the contour label option is selected in the ''Contour Options'' dialog, labels are automatically placed on the contours. | ||
[[File: | [[File:WMS ContourLabels.png|thumb|none|325 px]] | ||
* In some modules, contour labels can be added manually to contours by selecting the '''Contour Labels''' tool [[ | * In some modules, contour labels can be added manually to contours by selecting the '''Contour Labels''' tool [[File:WMS ContourLabelsTool.svg|16 px]] in the [[WMS:Drawing Tools|Tool Palette]] and clicking on the contours where labels are desired. By default, the dataset value corresponding to the point that was clicked is computed and a label corresponding to the nearest contour value is drawn centered at the point that was clicked. An option can be set in the ''Contour Label Options'' dialog to use the exact value at the point that is clicked as opposed to using the nearest contour value. This option is useful to post dataset value labels in regions where there are no contours. | ||
[[File: | [[File:WMSContourLabels.png|thumb|none|325 px]] | ||
If the mouse button is held down, a box showing the outline of the label is drawn. The box can then be positioned precisely with the mouse. A line is drawn from the box to the point that was clicked to help | If the mouse button is held down, a box showing the outline of the label is drawn. The box can then be positioned precisely with the mouse. A line is drawn from the box to the point that was clicked to help keep track of the contour that was selected. Contour labels can be deleted by holding down the ''SHIFT'' key while clicking on a label. | ||
The orientation of labels can either be parallel with the contours or always horizontal on the screen | The orientation of labels can either be parallel with the contours or always horizontal on the screen | ||
| Line 86: | Line 86: | ||
Regardless of which option is selected for the contour interval, a maximum and a minimum contour value can be specified and the contouring can be restricted to the specified range. | Regardless of which option is selected for the contour interval, a maximum and a minimum contour value can be specified and the contouring can be restricted to the specified range. | ||
[[File: | [[File:ContourSpecifiedRange.png|thumb|none|350 px]] | ||
===Contour Colors=== | ===Contour Colors=== | ||
The options in the lower right corner of the ''Contour Options'' dialog define what colors are used when the contours are displayed. The [[ | The options in the lower right corner of the ''Contour Options'' dialog define what colors are used when the contours are displayed. The [[Choose Color Ramp|'''Color Options''' button]] is used to set the default contour color. | ||
==Related Topics== | ==Related Topics== | ||
* [[WMS:Display Options|Display Options]] | * [[WMS:Display Options|Display Options]] | ||
*[[Choose Color Ramp]] | |||
* [[WMS:Color Ramp|Color Ramp]] | * [[WMS:Color Ramp|Color Ramp]] | ||
| Line 99: | Line 100: | ||
{{WMSMain}} | {{WMSMain}} | ||
[[Category:WMS Display Options|C]] | [[Category:WMS Display Options|C]] | ||
[[Category:WMS Dialogs | [[Category:WMS Display Dialogs]] | ||
Latest revision as of 21:56, 16 May 2023
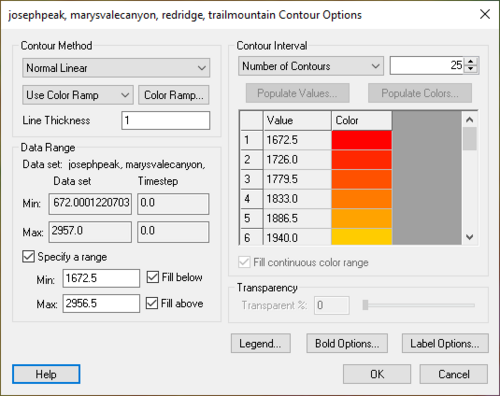
The options used to generate contours can be edited by selecting the Contour Options command in the Display menu. Each object that can be contoured (i.e. DEMs, TINs, Grids, Flood Plains) has its own set of contour options. This means there can be color filled contours for a DEM and linear contours on a TIN at the same time. The set of contour options being edited is determined by either the current module and/or the display options dialog from which the contour options are activated. For 2D grids there is set of contour options associated with dataset and the options of each dataset can be specified by right-clicking on the dataset folder from the Tree window, or by selecting an active dataset and choosing the Contour Options command or Macro.
The items in the Contour Options dialog are as follows:
Dataset Information
The values shown in the upper left corner of the dialog correspond to the maximum and minimum values in the active dataset (TIN, DEM, etc.). These values are useful when choosing an appropriate contour interval.
Contour Interval
Three options are provided for defining contour intervals in the Contour Options dialog. The options are as follows:
Number of Contours
With the Number of Contours option, an integer is entered representing the total number of contours. The contour interval is adjusted based on the current active dataset so that the contours are evenly spaced and the number of contours correspond exactly to the specified value.
Specified Interval
With the Specified Interval option, the contour interval (5, 10, 20, etc.) is entered directly.
Specified Values
The Specified Values option allows entering a list specific contour values. Contours are only generated at these values.
If the Log Scale option is selected, WMS automatically assigns contour intervals as multiples of 10. Furthermore, if the color-fill or color ramp option is being used, the colors assigned to the contours are distributed in a logarithmic fashion, rather than linearly interpolated from the low to high values.
Contour Method
The options at the lower left of the dialog control how the contours are computed. Three contouring methods are available:
Normal Linear Contours
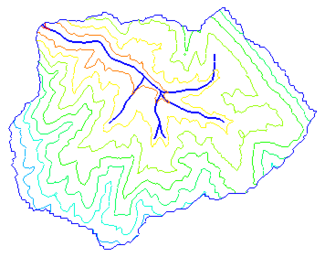
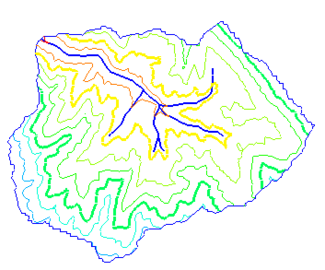
The default method is Normal linear contours and results in the contours being displayed as piece-wise linear strings.
Color Fill Between Contours
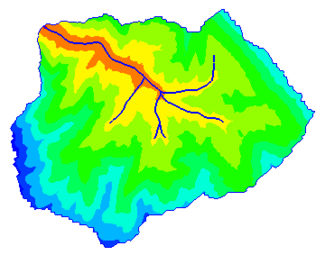
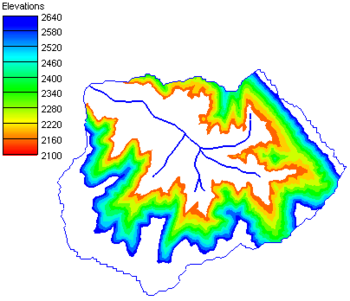
If the Color fill between contours button is selected, the region between adjacent contour lines is filled with a solid color. For DEMs each DEM grid cell is filled with the color corresponding to the elevation of that cell. For 2D Grids the color fill can be smoothed across cell boundaries (similar to the TINs method) or cell filled (similar to the DEM method).
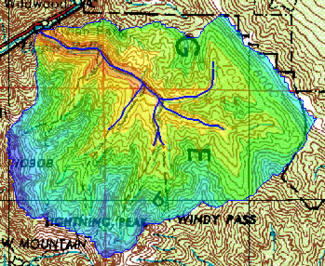
A transparency value can be set for color filled contours so that an image or other data can be seen through the color filled contours.
Cubic Spline Contours
If the Cubic spline contours button is selected, the contours are computed in strings and drawn as cubic splines. In some cases, drawing the contours as splines can cause the contours to appear smoother.
Occasionally, loops appear in the splines or the splines cross neighboring contour splines. These problems can sometimes be fixed by adding tension to the splines. A tension factor greater than zero causes the cubic spline to be blended with or converge to a linear spline based on the same set of points. A tension factor of unity causes the cubic spline to coincide with the linear spline.
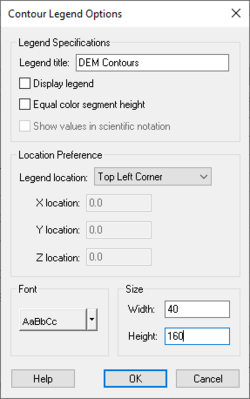
Legend
A legend displaying the range of colors and associated values can be turned on for the current set of contour options. The legend options include a title, font, size and position. By default the legend will be placed in the upper left of the graphics window, but can be positioned in the other three corners as well. This is important when displaying contours of more than one dataset at a time.
Bold Contours
The Bold every... option can be used to display contours at selected intervals with a thicker line width.
Contour Labels
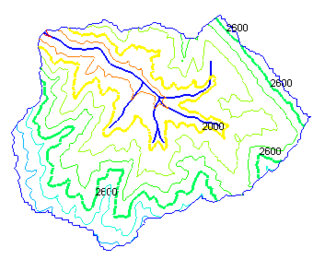
The Label every... option can be used to plot labels on contours at selected intervals. The contour label options are edited using the Contour Labels dialog.
The Contour Label Options tab in the Contour Options dialog is used to set the label color and font, the number of decimal places used to plot the label, and the spacing used when the labels are generated automatically. The default spacing value controls the placement of labels when labels are generated automatically. Labels can be added to contours in one of two ways:
- If the contour label option is selected in the Contour Options dialog, labels are automatically placed on the contours.
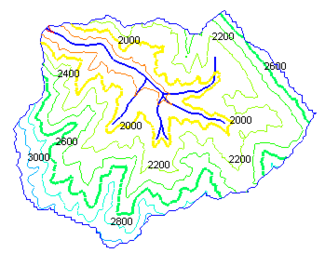
- In some modules, contour labels can be added manually to contours by selecting the Contour Labels tool
 in the Tool Palette and clicking on the contours where labels are desired. By default, the dataset value corresponding to the point that was clicked is computed and a label corresponding to the nearest contour value is drawn centered at the point that was clicked. An option can be set in the Contour Label Options dialog to use the exact value at the point that is clicked as opposed to using the nearest contour value. This option is useful to post dataset value labels in regions where there are no contours.
If the mouse button is held down, a box showing the outline of the label is drawn. The box can then be positioned precisely with the mouse. A line is drawn from the box to the point that was clicked to help keep track of the contour that was selected. Contour labels can be deleted by holding down the SHIFT key while clicking on a label.
The orientation of labels can either be parallel with the contours or always horizontal on the screen
The Remove Current Labels button will eliminate all contour labels, whether they were created with the labeling tool or automatically.
Contour Specified Range
Regardless of which option is selected for the contour interval, a maximum and a minimum contour value can be specified and the contouring can be restricted to the specified range.
Contour Colors
The options in the lower right corner of the Contour Options dialog define what colors are used when the contours are displayed. The Color Options button is used to set the default contour color.
Related Topics
WMS – Watershed Modeling System | ||
|---|---|---|
| Modules: | Terrain Data • Drainage • Map • Hydrologic Modeling • River • GIS • 2D Grid • 2D Scatter |  |
| Models: | CE-QUAL-W2 • GSSHA • HEC-1 • HEC-HMS • HEC-RAS • HSPF • MODRAT • NSS • OC Hydrograph • OC Rational • Rational • River Tools • Storm Drain • SMPDBK • SWMM • TR-20 • TR-55 | |
| Toolbars: | Modules • Macros • Units • Digitize • Static Tools • Dynamic Tools • Drawing • Get Data Tools | |
| Aquaveo | ||
