WMS:Customization Dialog: Difference between revisions
m (Jmonson moved page WMS:Customization... Dialog to WMS:Customization Dialog) |
|||
| Line 33: | Line 33: | ||
**''Color'' – The plot is shown in full color. | **''Color'' – The plot is shown in full color. | ||
**''Monochrome'' &ndash The plot is shown in black and white. | **''Monochrome'' &ndash The plot is shown in black and white. | ||
**''Monochrome + Symbols – The plot is shown in black and white and also uses symbols for some features. | **''Monochrome + Symbols'' – The plot is shown in black and white and also uses symbols for some features. | ||
*''Font Size'' section – Three size options: ''Large'', ''Medium'', and ''Small''. | *''Font Size'' section – Three size options: ''Large'', ''Medium'', and ''Small''. | ||
*''Numeric Precision'' section – Has options for 1-7. | *''Numeric Precision'' section – Has options for 1-7. | ||
Revision as of 16:57, 23 July 2024
The Customization... dialog allows editing many plot properties. Open the Profile Customization dialog multiple ways:
- Double-click on the plot.
- Right-click on the plot and select Display Options....
The plot options are organized onto the following tabs in the dialog:
- General
- Plot
- Axis
- Font
- Color
- Style
At the bottom of the dialog are five buttons:
- OK – Applies any changes and closes the Customization... dialog.
- Cancel – Cancels any unapplied changes and closes the Customization... dialog.
- Apply – Applies any changes made in the Customization... dialog.
- Export... – Closes the Customization... dialog and brings up the Exporting dialog.
- Maximize... – Maximizes the plot and closes the Customization... dialog.
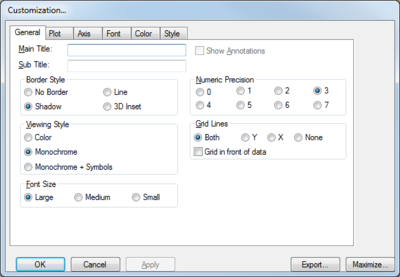
General Tab
The General tab has the following options:
- Main Title – Allows changing the title of the plot.
- Subtitle – Allows changing the subtitle of the plot.
- Show Annotations –
- Border Style section
- No Border – No border around the plot.
- Shadow – A drop-shadow appears under the plot, giving a 3D effect.
- Line – A single line is placed around the plot.
- 3D Inset – The plot appears to be inset in the dialog.
- Viewing Style section
- Color – The plot is shown in full color.
- Monochrome &ndash The plot is shown in black and white.
- Monochrome + Symbols – The plot is shown in black and white and also uses symbols for some features.
- Font Size section – Three size options: Large, Medium, and Small.
- Numeric Precision section – Has options for 1-7.
- Grid Lines section
- Both – Shows grid lines in both X and Y directions.
- Y – Shows grid lines in only the Y direction.
- X – Shows grid lines in only the X direction.
- None – Shows no grid lines.
- Grid in front of data – The grid lines are shown in front of arcs, labels, and anything else in the plot.
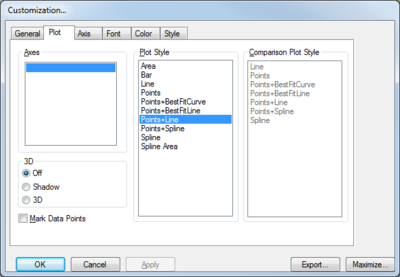
Plot Tab
The Plot tab has the following options:
- Axes section – A list of axes in the plot.
- Plot Style section – Several options for the appearance of the plot:
- ''Area – Shows 3D embossed area polygons.
- ''Bar – Shows the data in bar chart format.
- ''Line – Shows the data as simple lines.
- ''Points – Shows the data as points.
- ''Points+BestFitCurve – Shows the data as points with best fit curves.
- ''Points+BestFitLine – Shows the data as points with best fit lines.
- ''Points+Line – Shows the data as points and simple lines.
- ''Points+Spline – Shows the data as points and spline curves
- ''Spline – Shows the data as spline curves.
- ''Spline Area – Shows 3D embossed area polygons based on spline curves.
- Comparison Plot Style
- Line
- Points
- Points+BestFitCurve
- Points+BestFitLine
- Points+Line
- Points+Spline
- Spline
- 3D – Only affects the two options using "Area" styles.
- Off – Additional 3D effects are turned off.
- Shadow &ndash Makes the 3D effect a little darker.
- 3D – Adds a drop-shadow effect to enhance the 3D look.
- Mark Data Points – Data points are marked with bold points.
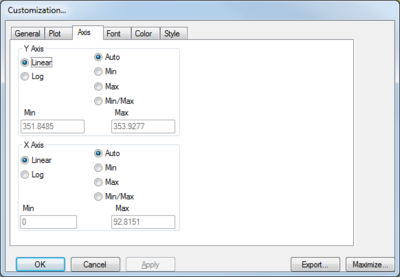
Axis Tab
The Axis tab allows adjustment of X and Y axis information. They can be set independently of each other. Each section has the following two options on the left:
- Linear – Uses linear coordinates.
- Log – Uses logarithmic coordinates.
The following options are on the right:
- Auto
- Min
- Max
- Min/Max
At the bottom of each section are Min and Max fields which can be edited if the Min/Max option is selected.
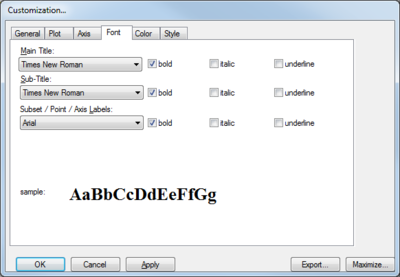
Font Tab
The Font tab allows selection of the font style for each of the following:
- Main Title
- Subtitle
- Subset / Point / Axis Labels
Generally, any font installed on the computer being used can be selected from the drop-down lists. Note that some font choices may be more readable than others. Options for bold, italic, and underline are available to the right of each drop-down.
When changing the fonts using the drop-downs and options, a sample of the selected font will display in the sample section at the bottom.
Color Tab
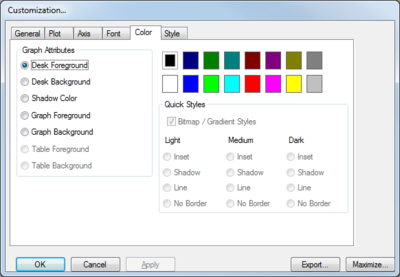
The Color tab allows for changing a variety of color options. Options on this tab are applied immediately upon selection. There are three section on this tab:
- Graph Attributes section:
- Desk Foreground – Changes the color of along the edges of the axes.
- Desk Background – Changes the background behind the plot.
- Shadow Color – Changes the color of the drop-shadow behind the plot.
- Graph Foreground – Changes the color of the gridlines on the plot.
- Graph Background – Changes the background color of the plot.
- Table Foreground
- Table Background
- Color selection section – Contains swatches of sixteen different colors that can be used when changing the Graph Attributes section.
- Quick Styles section
- Bitmap/Gradient Styles – If turned on, changes the Light, Medium, and Dark options to use bitmap backgrounds and/or gradients.
- Light, Medium, and Dark radio buttons - A number of preset color sets.
Style Tab
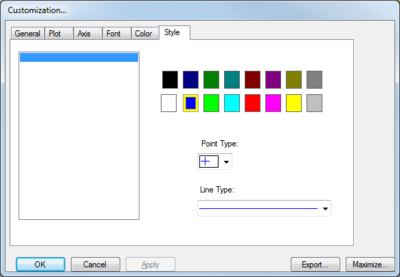
The Style tab has a list of styles on the left. On the right is a color selection section and two drop-downs:
- Point Type – A drop-down graphical list of several point type styles.
- Line Type – A drop-down graphical list of several line type styles.
Related Topics
WMS – Watershed Modeling System | ||
|---|---|---|
| Modules: | Terrain Data • Drainage • Map • Hydrologic Modeling • River • GIS • 2D Grid • 2D Scatter |  |
| Models: | CE-QUAL-W2 • GSSHA • HEC-1 • HEC-HMS • HEC-RAS • HSPF • MODRAT • NSS • OC Hydrograph • OC Rational • Rational • River Tools • Storm Drain • SMPDBK • SWMM • TR-20 • TR-55 | |
| Toolbars: | Modules • Macros • Units • Digitize • Static Tools • Dynamic Tools • Drawing • Get Data Tools | |
| Aquaveo | ||
