WMS:XY Series Editor: Difference between revisions
No edit summary |
No edit summary |
||
| (2 intermediate revisions by one other user not shown) | |||
| Line 3: | Line 3: | ||
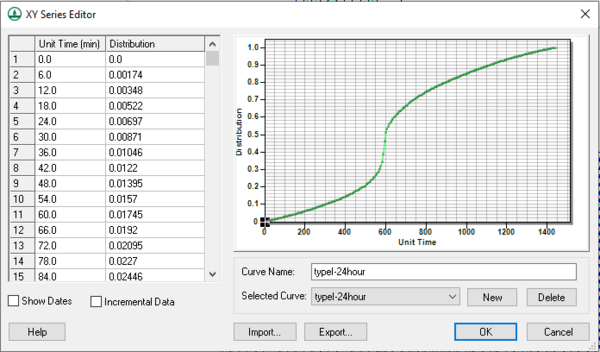
[[Image:WMS XY SeriesEditor.jpg|thumb|none|left|600 px|Example of the ''XY Series Editor'' dialog.]] | [[Image:WMS XY SeriesEditor.jpg|thumb|none|left|600 px|Example of the ''XY Series Editor'' dialog.]] | ||
The ''Show Dates'' | ===The XY Edit Fields=== | ||
The two vertical columns of edit fields on the left side of the dialog are for direct editing of the xy series values. A pair of application-specific titles appears at the top of the columns. | |||
The buttons below the xy edit fields are used to manipulate the values in the edit fields. The buttons and fields are as follows: | |||
*''Show Dates'' – Used to display the date and time at each point if the data is time series data. | |||
*''Incremental Data'' – Used if the data is incremental data instead of cumulative data, such as incremental precipitation data. | |||
*'''Import''' – Import data in XY series or DSS file formats. | |||
*'''Export''' – Export the data in XY series or DSS file formats. | |||
*'''Help''' – Brings up this wiki page. | |||
*''Curve Name'' – Enter a name for the curve. Will default to the selected curve of the drop-down menu. | |||
*''Selected Curve'' – Brings up a list of possible curves | |||
*'''New''' – Brings up a blank editor. | |||
*'''Delete''' – Deletes what was there. If nothing was created or imported, defaults to the next curve on the drop-down menu. | |||
*'''OK''' – Confirms inputs and closes ''XY Series Editor''. | |||
*'''Cancel''' – Closes editor without saving settings. | |||
===The XY Series Plot=== | |||
The window on the right side of the ''XY Series Editor'' is used to plot the curve corresponding to the xy values in the edit fields. As each value in the edit fields is edited, the corresponding point on the curve is adjusted instantaneously. Plot options are accessed by right-clicking on the plot. | |||
| Line 16: | Line 35: | ||
[[Category:WMS General Information|X]] | [[Category:WMS General Information|X]] | ||
[[Category:WMS Dialogs|X]] | [[Category:WMS Dialogs|X]] | ||
[[Category:WMS Plot]] | |||
{{stub}} | {{stub}} | ||
Latest revision as of 18:56, 25 July 2024
Use the XY Series Editor to edit, import, and export time series and XY series data. This data can include precipitation, discharge, and other parameters versus time or other data such as elevation-area and elevation-discharge curves.
The XY Edit Fields
The two vertical columns of edit fields on the left side of the dialog are for direct editing of the xy series values. A pair of application-specific titles appears at the top of the columns.
The buttons below the xy edit fields are used to manipulate the values in the edit fields. The buttons and fields are as follows:
- Show Dates – Used to display the date and time at each point if the data is time series data.
- Incremental Data – Used if the data is incremental data instead of cumulative data, such as incremental precipitation data.
- Import – Import data in XY series or DSS file formats.
- Export – Export the data in XY series or DSS file formats.
- Help – Brings up this wiki page.
- Curve Name – Enter a name for the curve. Will default to the selected curve of the drop-down menu.
- Selected Curve – Brings up a list of possible curves
- New – Brings up a blank editor.
- Delete – Deletes what was there. If nothing was created or imported, defaults to the next curve on the drop-down menu.
- OK – Confirms inputs and closes XY Series Editor.
- Cancel – Closes editor without saving settings.
The XY Series Plot
The window on the right side of the XY Series Editor is used to plot the curve corresponding to the xy values in the edit fields. As each value in the edit fields is edited, the corresponding point on the curve is adjusted instantaneously. Plot options are accessed by right-clicking on the plot.
Related Topics
WMS – Watershed Modeling System | ||
|---|---|---|
| Modules: | Terrain Data • Drainage • Map • Hydrologic Modeling • River • GIS • 2D Grid • 2D Scatter |  |
| Models: | CE-QUAL-W2 • GSSHA • HEC-1 • HEC-HMS • HEC-RAS • HSPF • MODRAT • NSS • OC Hydrograph • OC Rational • Rational • River Tools • Storm Drain • SMPDBK • SWMM • TR-20 • TR-55 | |
| Toolbars: | Modules • Macros • Units • Digitize • Static Tools • Dynamic Tools • Drawing • Get Data Tools | |
| Aquaveo | ||
