WMS:Post Processing: Difference between revisions
| Line 27: | Line 27: | ||
===Annual Exceedance Probability (AEP) Map=== | ===Annual Exceedance Probability (AEP) Map=== | ||
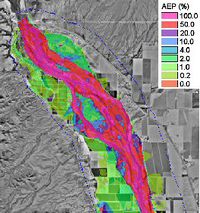
When using the stochastic hydrologic/hydraulic/floodplain delineation tools it is possible to generate an annual exceedance probability map. This is done by generating inundation maps that consider the range of all possible floods for all return periods. The result is a map that identifies the annual exceedance probability of flooding for every TIN vertex. For example if a point is flooded 10 times in 1000 simulations then it would represent the .01 probability. The [[WMS:Return Period to Feature Objects|Return Period → Feature Objects...]] command allows you to generate contours from the AEP map for specified return periods. | When using the stochastic hydrologic/hydraulic/floodplain delineation tools it is possible to generate an annual exceedance probability map. This is done by generating inundation maps that consider the range of all possible floods for all return periods. The result is a map that identifies the annual exceedance probability of flooding for every TIN vertex. For example if a point is flooded 10 times in 1000 simulations then it would represent the .01 probability. The [[WMS:Return Period to Feature Objects|Return Period → Feature Objects...]] command allows you to generate contours from the AEP map for specified return periods. You should remember that such a map does not represent a solution from a single set of input parameters, but is rather the composite of several hundred or thousand simulations. | ||
[[Image:AEPMAP.jpg|thumb|none|left|200px]] | [[Image:AEPMAP.jpg|thumb|none|left|200px]] | ||
Revision as of 20:34, 4 March 2013
After finishing a stochastic simulation there are two primary results read back into WMS for each simulation: hydrographs from the HEC-1 model, and the floodplain depths and water surface elevations for each run.
Hydrographs
A series of hydrographs are loaded for each hydrograph station and can be viewed in the normal way hydrographs are viewed.
Floodplains
Each floodplain delineation results in a water surface elevation and a flood depth dataset. Each pair of datasets are organized in a folder underneath the TIN in the Project Explorer. You can set the contour options for a TIN and select the dataset you wish to be active and displayed from the Project Explorer.
| File:Image330.gif |
Probabilistic Floodplain Boundary
A final dataset showing the probability of flooding is also created from all of the individual floodplain datasets. The probabilistic flood plain indicates for each vertex on the TIN the percentage of model runs that resulting in inundation at the point.
File:Image136.jpg Close up view |
Annual Exceedance Probability (AEP) Map
When using the stochastic hydrologic/hydraulic/floodplain delineation tools it is possible to generate an annual exceedance probability map. This is done by generating inundation maps that consider the range of all possible floods for all return periods. The result is a map that identifies the annual exceedance probability of flooding for every TIN vertex. For example if a point is flooded 10 times in 1000 simulations then it would represent the .01 probability. The Return Period → Feature Objects... command allows you to generate contours from the AEP map for specified return periods. You should remember that such a map does not represent a solution from a single set of input parameters, but is rather the composite of several hundred or thousand simulations.
Previous Step in Stochastic Modeling
Related Topics
WMS – Watershed Modeling System | ||
|---|---|---|
| Modules: | Terrain Data • Drainage • Map • Hydrologic Modeling • River • GIS • 2D Grid • 2D Scatter |  |
| Models: | CE-QUAL-W2 • GSSHA • HEC-1 • HEC-HMS • HEC-RAS • HSPF • MODRAT • NSS • OC Hydrograph • OC Rational • Rational • River Tools • Storm Drain • SMPDBK • SWMM • TR-20 • TR-55 | |
| Toolbars: | Modules • Macros • Units • Digitize • Static Tools • Dynamic Tools • Drawing • Get Data Tools | |
| Aquaveo | ||
