WMS:2D Grid Module Project Explorer: Difference between revisions
No edit summary |
No edit summary |
||
| Line 23: | Line 23: | ||
The Project Explorer allows access to individual contour options for each dataset. When a dataset is read in it is given the default set of contour options that can then be modified by right-clicking on the dataset in the ''Project Explorer''. Whichever dataset is active is the only dataset contoured. The contours for the grid come from the active dataset whereas the elevations of the grid come from the current elevation dataset. This setup allows the results of a GSSHA simulation to be displayed as contours on a grid that is shaped like the underlying terrain. In the ''Project Explorer'' the active dataset is shown with a yellow icon and bold lettering and the current elevation dataset has "elev" after the name of the dataset. | The Project Explorer allows access to individual contour options for each dataset. When a dataset is read in it is given the default set of contour options that can then be modified by right-clicking on the dataset in the ''Project Explorer''. Whichever dataset is active is the only dataset contoured. The contours for the grid come from the active dataset whereas the elevations of the grid come from the current elevation dataset. This setup allows the results of a GSSHA simulation to be displayed as contours on a grid that is shaped like the underlying terrain. In the ''Project Explorer'' the active dataset is shown with a yellow icon and bold lettering and the current elevation dataset has "elev" after the name of the dataset. | ||
==Right-Click Options== | |||
In the 2D Grid module, the grid and associated datasets are listed in the Project Explorer (WMS only allows users to work with one grid). | |||
:[[Image:WMS_GridProjectExplorer1.png|180 px]] | |||
Right-clicking on the main 2D Grid Data folder allows users to create a '''New Grid''', '''New folder''', or GSSHA Model options. | |||
:[[Image:WMS_GridProjectExplorer2.png|200 px]] | |||
:[[Image:WMS_GridProjectExplorer3.png|200 px]] | |||
Right-clicking on the dataset for a grid allows users to '''Export''', '''Rename''', view '''Properties''', '''View Values''', set '''Contour Options''', and '''Set as Elevations'''. | |||
:[[Image:WMS_GridProjectExplorer4.png|200 px]] | |||
==Related Topics== | ==Related Topics== | ||
* [[WMS:GSSHA Maps|GSSHA Maps]] | * [[WMS:GSSHA Maps|GSSHA Maps]] | ||
* [[WMS:Project Explorer Overview|Project Explorer Overview]] | |||
* [[Coordinate Conversions]] | |||
Revision as of 17:22, 7 January 2016
The Project Explorer serves as a means of organizing all the datasets associated with the several models and modules in WMS. In the 2D Grid module, the Project Explorer serves to store and modify the attributes of all gridded datasets.
Datasets
The Project Explorer serves as a manager for all of the gridded datasets that have been read into WMS. When other modules are active the Project Explorer references TINs, DEMs, Scatterpoint sets, Coverages, and other data storage types. The main strength of the Project Explorer lies in consolidating access to the datasets. Right-clicking on a dataset brings up a list of options that are available for that data type. In the 2D Grid module, when a dataset is right-clicked, a menu appears that offers the following options: exporting the dataset, renaming the dataset, viewing the properties of the dataset, setting the contour options for the dataset, viewing the values of the dataset, setting the dataset to be the grid elevations, and writing to an ASCII grid file.
Index Maps
Unique to GSSHA are special datasets that serve as index maps that link simulation parameters to their spatial distribution. The principle means of modifying and creating index maps is in the Index Map dialog but the index maps are now also able to be accessed through the Project Explorer. When an index map has been created or read into WMS, a folder appears in the Project Explorer, named Index Maps, that contains all of the index maps for the simulation. Index maps can then be treated like regular datasets; they can be contoured, renamed, deleted, and edited.
Solutions
While solutions are not new to GSSHA, being able to work with them in WMS is a new feature. Accessible from the GSSHA menu in the 2D Grid module is the command Read Solution which looks for a GSSHA project file and then reads in all of the associated datasets and lumps them together into a solution folder in the Project Explorer. Solution folders are identified by a lowercase "s" on the folder. All of the datasets in the folder are treated as regular datasets. Organizing the datasets into a solution allows several solutions to be in memory at the same time. Several dialogs look for solutions and the associated datasets to set up and display output graphs. Along with the regular datasets, the summary file for the project is also accessible for each solution by double-clicking the summary file Project Explorer item under the solution folder.
Individual solution output time series data for a cell may be viewed from the Solution Results dialog accessed from the Feature Point/Node Type dialog. This dialog will only show the output dataset time series for the cell that underlies the feature point selected. To compare the solution output at a cell with observed data, see GSSHA Observation Points.
Contour Options
New to WMS 7.0 is the use of OpenGL code for much better graphics display. OpenGL is a 3D graphics library that makes displaying graphics in WMS much faster and more efficient. The grid display routines in WMS have been enhanced with a better interpolation scheme that allows for a much smoother grid display as well as taking advantage of the strengths of OpenGL. The contouring routines have been redone to also use the enhanced grid and OpenGL, which results in faster, smoother surfaces that are continuous color contoured as opposed to step color contoured as in WMS 6.1. Also, OpenGL shades surfaces automatically, so this option is always turned on when the contour is color filled.
Cell filling the grid has been an option since WMS 6.1. However, WMS 7.0 allows much more flexibility in visualizing the output and input to GSSHA through cell filling by making it into part of the contour options. Simply ensure that the cell filled radio button is selected, and each cell will be filled with the color that represents the data point at the center of the cell. This color is taken from a smooth (linearly interpolated) color ramp. Cell filling is independent of block-style cell display, which is set in the display options.
The Project Explorer allows access to individual contour options for each dataset. When a dataset is read in it is given the default set of contour options that can then be modified by right-clicking on the dataset in the Project Explorer. Whichever dataset is active is the only dataset contoured. The contours for the grid come from the active dataset whereas the elevations of the grid come from the current elevation dataset. This setup allows the results of a GSSHA simulation to be displayed as contours on a grid that is shaped like the underlying terrain. In the Project Explorer the active dataset is shown with a yellow icon and bold lettering and the current elevation dataset has "elev" after the name of the dataset.
Right-Click Options
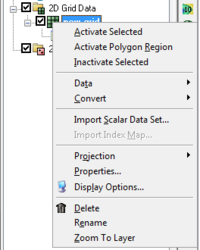
In the 2D Grid module, the grid and associated datasets are listed in the Project Explorer (WMS only allows users to work with one grid).
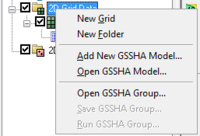
Right-clicking on the main 2D Grid Data folder allows users to create a New Grid, New folder, or GSSHA Model options.
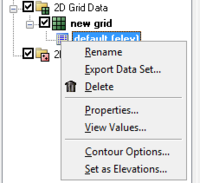
Right-clicking on the dataset for a grid allows users to Export, Rename, view Properties, View Values, set Contour Options, and Set as Elevations.
Related Topics
WMS – Watershed Modeling System | ||
|---|---|---|
| Modules: | Terrain Data • Drainage • Map • Hydrologic Modeling • River • GIS • 2D Grid • 2D Scatter |  |
| Models: | CE-QUAL-W2 • GSSHA • HEC-1 • HEC-HMS • HEC-RAS • HSPF • MODRAT • NSS • OC Hydrograph • OC Rational • Rational • River Tools • Storm Drain • SMPDBK • SWMM • TR-20 • TR-55 | |
| Toolbars: | Modules • Macros • Units • Digitize • Static Tools • Dynamic Tools • Drawing • Get Data Tools | |
| Aquaveo | ||


