WMS:OC Unit Hydro Unit Hydrograph Method: Difference between revisions
No edit summary |
|||
| (2 intermediate revisions by the same user not shown) | |||
| Line 1: | Line 1: | ||
[[File:OC UnitHydrograph.png|thumb|400 px|Orange County Unit Hydrograph]] | |||
A lag time and S-graph are required to compute a unit hydrograph. Compute a unit hydrograph for a basin by first selecting the basin and then choosing the '''Unit Hydrograph Method...''' button from the [[WMS:Orange County Unit Hydrograph|''Edit Orange County Unit Hydrograph Parameters'']] dialog. | A lag time and S-graph are required to compute a unit hydrograph. Compute a unit hydrograph for a basin by first selecting the basin and then choosing the '''Unit Hydrograph Method...''' button from the [[WMS:Orange County Unit Hydrograph|''Edit Orange County Unit Hydrograph Parameters'']] dialog. | ||
| Line 20: | Line 21: | ||
[[Category:OC Unit Hydrograph|U]] | [[Category:OC Unit Hydrograph|U]] | ||
[[Category:Equations|OC Unit Hydro]] | [[Category:Equations|OC Unit Hydro]] | ||
[[Category:WMS Plot]] | |||
[[Category:OC Unit Dialogs|uni]] | |||
Latest revision as of 16:18, 7 December 2017
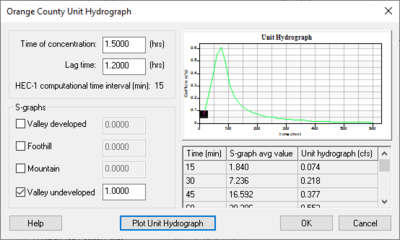
A lag time and S-graph are required to compute a unit hydrograph. Compute a unit hydrograph for a basin by first selecting the basin and then choosing the Unit Hydrograph Method... button from the Edit Orange County Unit Hydrograph Parameters dialog.
Lag Time
Basin lag time (hrs) is usually based on the time of concentration (Tc) computed using the rational method analysis. Lag time is automatically calculated to be 0.8*Tc when entering a value for Tc, but it is always possible to enter any value for lag time. Entering a Tc value is not required because it is only used to compute lag time.
S-graphs
There are four standard S-graphs that are used in Orange County: valley developed, valley undeveloped, foothill, and mountain. Turn on the check box on next to each S-graph that is to be used. A composite S-graph is computed using the decimal weights assigned to each of the standard S-graphs.
The Plot Unit Hydrograph button computes the unit hydrograph using the lag time and composite S-graph and displays the results in both a graphical and tabular format.
Clicking on OK will write the unit hydrograph data to the UI card for analysis using HEC-1.
Related Topics
WMS – Watershed Modeling System | ||
|---|---|---|
| Modules: | Terrain Data • Drainage • Map • Hydrologic Modeling • River • GIS • 2D Grid • 2D Scatter |  |
| Models: | CE-QUAL-W2 • GSSHA • HEC-1 • HEC-HMS • HEC-RAS • HSPF • MODRAT • NSS • OC Hydrograph • OC Rational • Rational • River Tools • Storm Drain • SMPDBK • SWMM • TR-20 • TR-55 | |
| Toolbars: | Modules • Macros • Units • Digitize • Static Tools • Dynamic Tools • Drawing • Get Data Tools | |
| Aquaveo | ||
