WMS:Display Options: Difference between revisions
No edit summary |
|||
| (50 intermediate revisions by 3 users not shown) | |||
| Line 1: | Line 1: | ||
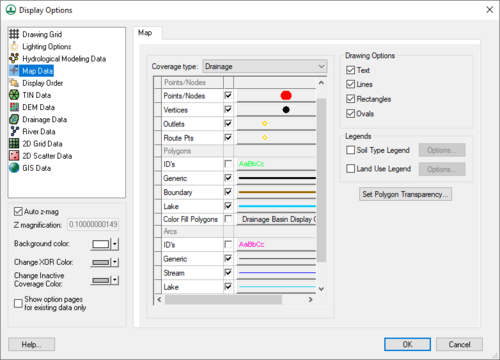
Most of the data types ([[WMS:Modules|modules]]) in WMS have a set of display options that can be modified using the '''Display Options''' command in the | Most of the data types ([[WMS:Modules|modules]]) in WMS have a set of display options that can be modified using the '''Display Options''' command in the ''Display'' menu. The '''Display Options''' command brings up the ''Display Options'' dialog shown below. The default tab in the dialog depends on which module is active. However, the display options of any module can be changed by changing to the appropriate tab. Some modules really use multiple tabs, such as the Terrain Data module which in addition to the ''TIN'' tab has the ''DEM'' tab and the ''TIN-Drainage'' tab. Also the ''Drainage Data'' tab controls the display of text with computed geometric parameters for watersheds done with either TINs or DEMs. The ''General'' tab has a few things that do not fit as part of any module such as the background color, the color used to contrast selections (XOR), as well as a few others. | ||
[[Image:WMSdisplayopts.jpg|thumb|500 px|Display Options dialog]] | |||
The check box next to the feature named can be toggled on or off to control whether or not the feature is to be displayed. The combo box will either display a [[#Changing Symbols|symbol]], [[#Changing Line Styles|line]], [[#Changing Text Fonts and Styles|text]], or [[#Changing Polygon Colors|polygon]] in the currently selected color depending on the type of feature. [[#Changing Color|Colors can be changed quickly]] by selecting the drop-down button, and other styles, fonts, sizes of attributes can be changed by selecting the button displaying the current setting (see descriptions below). | The check box next to the feature named can be toggled on or off to control whether or not the feature is to be displayed. The combo box will either display a [[#Changing Symbols|symbol]], [[#Changing Line Styles|line]], [[#Changing Text Fonts and Styles|text]], or [[#Changing Polygon Colors|polygon]] in the currently selected color depending on the type of feature. [[#Changing Color|Colors can be changed quickly]] by selecting the drop-down button, and other styles, fonts, sizes of attributes can be changed by selecting the button displaying the current setting (see descriptions below). | ||
Additionally, entire data objects can be turned off by un-checking the toggle box next to the data object from the Project Explorer. | Additionally, entire data objects can be turned off by un-checking the toggle box next to the data object from the Project Explorer. | ||
===Changing Color=== | ===Changing Color=== | ||
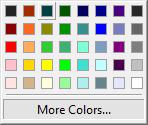
If | If selecting the drop-down arrow, a simplified color chooser appears that allows changing the color only of the attribute. | ||
[[Image:ColorPicker.png]] | |||
===Changing Symbols=== | ===Changing Symbols=== | ||
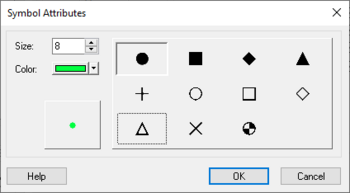
If | If wanting to change the symbol style or size, select the '''Symbol''' button. | ||
[[Image:WMSsymbolatt.jpg|thumb|350 px|none|left|Example of a ''Symbol Attributes'' dialog.]] | |||
===Changing Line Styles=== | ===Changing Line Styles=== | ||
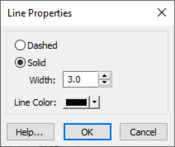
If | If wanting to change a line thickness or style, select the '''Line Symbol''' button. | ||
[[File:WMSlineproperties.jpg|thumb|none|left|175 px|Example of a ''Line Properties'' dialog.]] | |||
===Changing Polygon Colors=== | |||
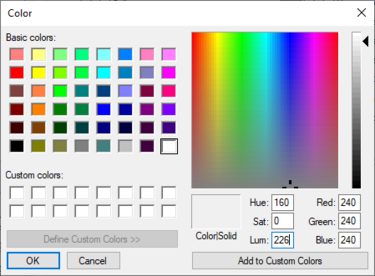
The more advanced color chooser is used to specify a polygon color, this is the same dialog that comes up when selecting '''More Colors...''' from the basic drop-down color chooser, or when selecting a color from within the ''Line or Symbol Attributes'' dialogs. | |||
[[Image:WMScolorpallette.jpg|thumb|none|left|375 px|Example of a ''Color'' dialog.]] | |||
===Changing | ===Changing Text Fonts and Styles=== | ||
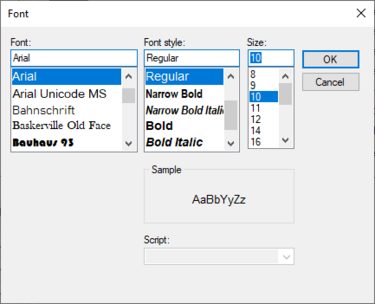
If wanting to change a font or font style, select the '''Text Symbol''' button. | |||
[[Image:WMSfont.jpg|thumb|none|left|375 px|Example of a ''Font'' dialog.]] | |||
===Lighting Options=== | |||
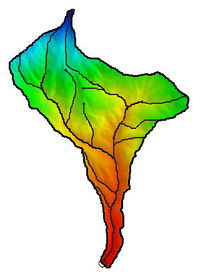
The ''Lighting Options'' option in the ''Display Options'' dialog can be used to set the light and shading of the image in the Graphics Window. When the ''Use light source'' option is selected, the image is shaded according to the intensity and lighting angle. When the ''Smooth features'' option is selected, the shading is smoothed. The image shows an example of a watershed that has color filled contours and the lighting and shading options applied. | |||
The default display mode for a TIN or 2D grids in the ''Graphics Window'' is a wire-frame image. Color shading and hidden surface removal can be applied to either TINs or 2D grids in order to generate a realistic image. Hill shaded images of DEMs can also be created with a DEM present. | |||
Images can be "draped" over a TIN if properly registered. This is controlled in the ''Image Display Options'' (found as a button on the ''Map'' tab in the ''Display Options'' dialog) by choosing to map the image to the TIN. If an image is mapped it will be draped and shaded over the TIN when using ''Lighting Options''. | |||
[[ | [[File:Draped and shaded image over a TIN.jpg|200 px]] | ||
==Related Topics== | ==Related Topics== | ||
* [[WMS:Contour Options|Contour Options]] | * [[WMS:Contour Options|Contour Options]] | ||
* [[WMS: | * [[WMS:Drawing_Tools#Drawing_Objects_Menu|Drawing Objects]] | ||
* [[WMS:Display Order|Display Order]] | |||
* [[WMS: | |||
{{WMSMain}} | {{WMSMain}} | ||
[[Category:WMS General Information|D]] | |||
[[Category:WMS Display Options|D]] | |||
[[Category:WMS Display Dialogs]] | |||
Latest revision as of 15:35, 28 September 2017
Most of the data types (modules) in WMS have a set of display options that can be modified using the Display Options command in the Display menu. The Display Options command brings up the Display Options dialog shown below. The default tab in the dialog depends on which module is active. However, the display options of any module can be changed by changing to the appropriate tab. Some modules really use multiple tabs, such as the Terrain Data module which in addition to the TIN tab has the DEM tab and the TIN-Drainage tab. Also the Drainage Data tab controls the display of text with computed geometric parameters for watersheds done with either TINs or DEMs. The General tab has a few things that do not fit as part of any module such as the background color, the color used to contrast selections (XOR), as well as a few others.
The check box next to the feature named can be toggled on or off to control whether or not the feature is to be displayed. The combo box will either display a symbol, line, text, or polygon in the currently selected color depending on the type of feature. Colors can be changed quickly by selecting the drop-down button, and other styles, fonts, sizes of attributes can be changed by selecting the button displaying the current setting (see descriptions below).
Additionally, entire data objects can be turned off by un-checking the toggle box next to the data object from the Project Explorer.
Changing Color
If selecting the drop-down arrow, a simplified color chooser appears that allows changing the color only of the attribute.
Changing Symbols
If wanting to change the symbol style or size, select the Symbol button.
Changing Line Styles
If wanting to change a line thickness or style, select the Line Symbol button.
Changing Polygon Colors
The more advanced color chooser is used to specify a polygon color, this is the same dialog that comes up when selecting More Colors... from the basic drop-down color chooser, or when selecting a color from within the Line or Symbol Attributes dialogs.
Changing Text Fonts and Styles
If wanting to change a font or font style, select the Text Symbol button.
Lighting Options
The Lighting Options option in the Display Options dialog can be used to set the light and shading of the image in the Graphics Window. When the Use light source option is selected, the image is shaded according to the intensity and lighting angle. When the Smooth features option is selected, the shading is smoothed. The image shows an example of a watershed that has color filled contours and the lighting and shading options applied.
The default display mode for a TIN or 2D grids in the Graphics Window is a wire-frame image. Color shading and hidden surface removal can be applied to either TINs or 2D grids in order to generate a realistic image. Hill shaded images of DEMs can also be created with a DEM present.
Images can be "draped" over a TIN if properly registered. This is controlled in the Image Display Options (found as a button on the Map tab in the Display Options dialog) by choosing to map the image to the TIN. If an image is mapped it will be draped and shaded over the TIN when using Lighting Options.
Related Topics
WMS – Watershed Modeling System | ||
|---|---|---|
| Modules: | Terrain Data • Drainage • Map • Hydrologic Modeling • River • GIS • 2D Grid • 2D Scatter |  |
| Models: | CE-QUAL-W2 • GSSHA • HEC-1 • HEC-HMS • HEC-RAS • HSPF • MODRAT • NSS • OC Hydrograph • OC Rational • Rational • River Tools • Storm Drain • SMPDBK • SWMM • TR-20 • TR-55 | |
| Toolbars: | Modules • Macros • Units • Digitize • Static Tools • Dynamic Tools • Drawing • Get Data Tools | |
| Aquaveo | ||
