WMS:Grid Options: Difference between revisions
From XMS Wiki
Jump to navigationJump to search
No edit summary |
|||
| (11 intermediate revisions by the same user not shown) | |||
| Line 1: | Line 1: | ||
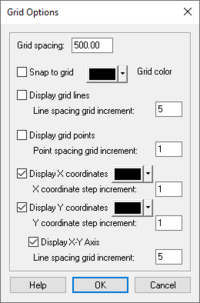
[[Image:WMSGridOpts.png|thumb|200 px|Example of the ''Grid Options'' dialog.]] | |||
When entering new vertices or entering a polygon or polyline, it is often useful to have the coordinates snap to a uniform grid. This allows accurate placement of the objects when the desired coordinates are even multiples of some number. | When entering new vertices or entering a polygon or polyline, it is often useful to have the coordinates snap to a uniform grid. This allows accurate placement of the objects when the desired coordinates are even multiples of some number. | ||
A drawing grid can be activated using the '''Grid Options''' command in the ''Display'' menu. | A drawing grid can be activated using the '''Grid Options''' command in the ''Display'' menu. | ||
; ''Grid Spacing'' : The ''Grid Spacing'' edit field specifies the spacing of the grid nodes and grid lines in the drawing grid. The Grid color window specifies the color that is used to display the drawing grid in the ''Graphics Window''. | |||
; ''Snap to Grid'' : If the ''Snap to grid'' option is selected, all new vertices, nodes, points, etc., snap to the closest grid point as they are being created or when they are dragged interactively. | |||
; ''Display Grid Lines'' : If the ''Display grid lines'' option is selected, grid lines are displayed according to the Grid line spacing increment. For example, if the ''Grid Spacing'' is set to 10 and the Grid line spacing increment is set to 5, a grid line will be drawn every 50 units. | |||
; ''Display Grid Points'' : If the ''Display grid points'' option is selected, grid points are displayed according to the Grid ''point spacing increment''. | |||
; ''Display X/Y Coordinates'' : If the ''Display X Coordinates'' or ''Display Y coordinates'' are selected then text with the coordinate values are displayed along the bottom (X coordinates) and left (Y coordinates) of the screen. | |||
If the '' | |||
; ''Display X-Y Axis'' : If the ''Display X-Y Axis'' is selected then an X-Y coordinate axis is displayed along the left and bottom of the screen. In combination with the Display X/Y Coordinates this is an excellent way to indicate the scale of the model. | |||
If the ''Display | |||
== | ==Related Topics== | ||
[[WMS:Display Menu|Display Menu]] | |||
{{WMSMain}} | |||
[[Category:WMS 2D Grid|G]] | |||
[[Category:WMS 2D Grid Dialogs]] | |||
[[WMS | |||
Latest revision as of 20:23, 12 December 2023
When entering new vertices or entering a polygon or polyline, it is often useful to have the coordinates snap to a uniform grid. This allows accurate placement of the objects when the desired coordinates are even multiples of some number.
A drawing grid can be activated using the Grid Options command in the Display menu.
- Grid Spacing
- The Grid Spacing edit field specifies the spacing of the grid nodes and grid lines in the drawing grid. The Grid color window specifies the color that is used to display the drawing grid in the Graphics Window.
- Snap to Grid
- If the Snap to grid option is selected, all new vertices, nodes, points, etc., snap to the closest grid point as they are being created or when they are dragged interactively.
- Display Grid Lines
- If the Display grid lines option is selected, grid lines are displayed according to the Grid line spacing increment. For example, if the Grid Spacing is set to 10 and the Grid line spacing increment is set to 5, a grid line will be drawn every 50 units.
- Display Grid Points
- If the Display grid points option is selected, grid points are displayed according to the Grid point spacing increment.
- Display X/Y Coordinates
- If the Display X Coordinates or Display Y coordinates are selected then text with the coordinate values are displayed along the bottom (X coordinates) and left (Y coordinates) of the screen.
- Display X-Y Axis
- If the Display X-Y Axis is selected then an X-Y coordinate axis is displayed along the left and bottom of the screen. In combination with the Display X/Y Coordinates this is an excellent way to indicate the scale of the model.
Related Topics
WMS – Watershed Modeling System | ||
|---|---|---|
| Modules: | Terrain Data • Drainage • Map • Hydrologic Modeling • River • GIS • 2D Grid • 2D Scatter |  |
| Models: | CE-QUAL-W2 • GSSHA • HEC-1 • HEC-HMS • HEC-RAS • HSPF • MODRAT • NSS • OC Hydrograph • OC Rational • Rational • River Tools • Storm Drain • SMPDBK • SWMM • TR-20 • TR-55 | |
| Toolbars: | Modules • Macros • Units • Digitize • Static Tools • Dynamic Tools • Drawing • Get Data Tools | |
| Aquaveo | ||
