WMS:Stochastic Modeling: Difference between revisions
| (41 intermediate revisions by the same user not shown) | |||
| Line 1: | Line 1: | ||
There is always a great deal of uncertainty in hydrologic and hydraulic modeling and the parameters that are used to develop solutions. Despite this, a typical | {{TOCright}} | ||
There is always a great deal of uncertainty in hydrologic and hydraulic modeling and the parameters that are used to develop solutions. Despite this, a typical floodplain boundary is black and white in that the project is either in or out of the floodplain. A good engineer might be able to dispute a floodplain boundary by performing a hydrologic/hydraulic analysis with a set of equally probable parameters that results in a difference in the floodplain delineation. Until recently, computer programs lacked the ability to consider multiple probable answers and report a probabilistic floodplain boundary, but with the Stochastic Modeling tools in WMS this is possible using a combination of HEC-1 for hydrologic analysis, HEC-RAS for 1D hydraulic river modeling, and the WMS floodplain delineation tools. | |||
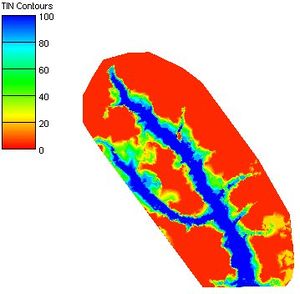
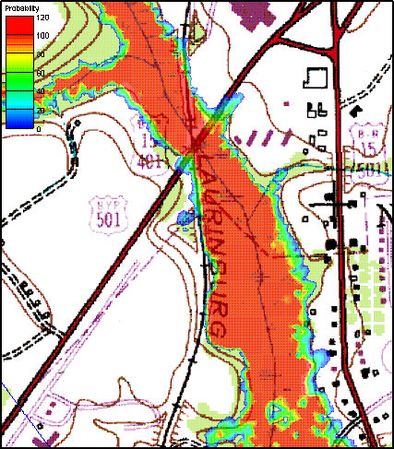
It is possible to connect the results of HEC-1 to a developed HEC-RAS model and then run them as many times consecutively, with the results of the HEC-1 analysis feeding the boundary conditions for an HEC-RAS model. Certain parameters (at this point only basin CN and precipitation within HEC-1, and Manning's roughness within HEC-RAS) can be varied within a range of reasonable values using Monte Carlo or Latin Hypercube simulations in order to create a number of simulations. The results of each HEC-RAS model can then be used to delineate a series of floodplains. The combination of all floodplains can then be examined in order to derive a "probabilistic" floodplain where a region flooded by 100% of the model simulation combinations can be distinguished from an area that is flooded by only 50% of the models as shown in the figure below: | |||
[[File: | :[[File:WMS StochasticModeling.jpg|thumb|none|left|300 px|]] | ||
The following steps outline the process for developing a stochastic model of floodplain boundaries using WMS, HEC-1, and HEC-RAS. | The following steps outline the process for developing a stochastic model of floodplain boundaries using WMS, HEC-1, and HEC-RAS. | ||
===Step 1. Develop a hydrologic model with HEC-1=== | ===Step 1. Develop a hydrologic model with HEC-1=== | ||
[[Image:StochasticRunParameters.jpg|thumb| | [[Image:StochasticRunParameters.jpg|thumb|450 px|''Stochastic Run Parameters'' dialog]] | ||
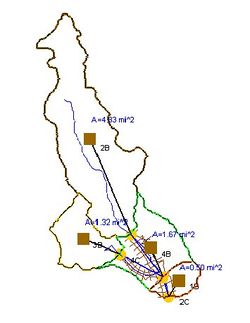
The HEC-1 Interface tools in WMS can be used to develop a working HEC-1 model. It is important that this model be running effectively (i.e. calibrated and/or adjusted to give credible results) prior to using it for the Stochastic Modeling simulation. | The HEC-1 Interface tools in WMS can be used to develop a working HEC-1 model. It is important that this model be running effectively (i.e. calibrated and/or adjusted to give credible results) prior to using it for the Stochastic Modeling simulation. | ||
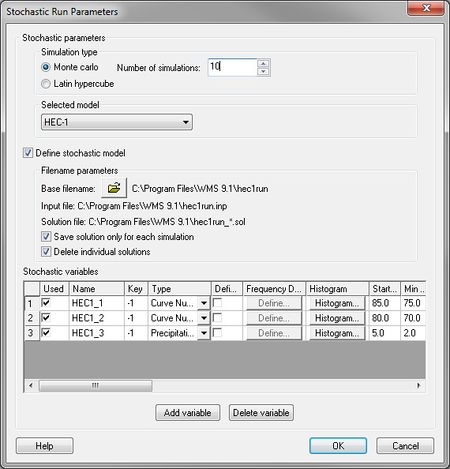
The only parameters at this point that can be varied within a range of probable answers are rainfall and CN (curve number for the different basins. This is done by setting the [[WMS:Basin HEC-1 Cards#Precipitation...|precipitation]] or [[WMS:Basin HEC-1 Cards#SCS Loss Method (LS)|CN]] to be a negative number in their respective dialogs. This negative number is a key number and should be unique for each stochastic variable created. When running the stochastic simulation WMS will substitute the simulation specific parameter for the defined key. Then setup a stochastic variable for HEC-1 in the ''Stochastic Run Parameters'' dialog. A key value (matching the key defined in the materials property) starting value, min value, max value, standard deviation and distribution type. | The only parameters at this point that can be varied within a range of probable answers are rainfall and CN (curve number for the different basins. This is done by setting the [[WMS:Basin HEC-1 Cards#Precipitation...|precipitation]] or [[WMS:Basin HEC-1 Cards#SCS Loss Method (LS)|CN]] to be a negative number in their respective dialogs. This negative number is a key number and should be unique for each stochastic variable created. When running the stochastic simulation WMS will substitute the simulation specific parameter for the defined key. Then setup a stochastic variable for HEC-1 in the ''Stochastic Run Parameters'' dialog. A key value (matching the key defined in the materials property) starting value, min value, max value, standard deviation and distribution type. | ||
:[[Image: | :[[Image:HEC1 HydrologicModel.jpg|thumb|none|left|250 px]] | ||
===Step 2. Develop a working model in HEC-RAS=== | ===Step 2. Develop a working model in HEC-RAS=== | ||
[[Image:ScholasticRunParameters2. | [[Image:ScholasticRunParameters2.png|thumb|450 px|''Stochastic Run Parameters'' dialog]] | ||
The [[WMS:Hydraulic Modeling|HEC-RAS interface]] tools in WMS can be used to developing a working HEC-RAS model. It is important that this model be running effectively (i.e. calibrated and/or adjusted to give credible results) prior to using it for the Stochastic Modeling simulation. | The [[WMS:Hydraulic Modeling|HEC-RAS interface]] tools in WMS can be used to developing a working HEC-RAS model. It is important that this model be running effectively (i.e. calibrated and/or adjusted to give credible results) prior to using it for the Stochastic Modeling simulation. | ||
:[[Image: | :[[Image:HECRAS WorkingModel.jpg|thumb|none|left|275 px]] | ||
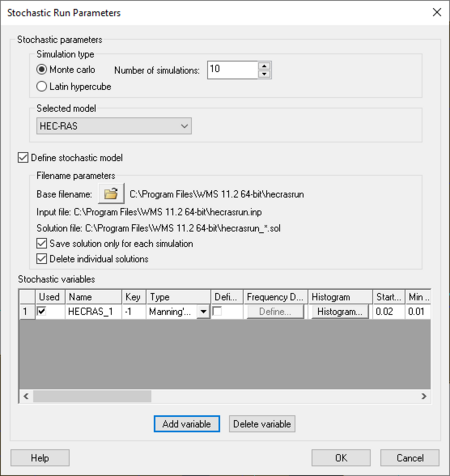
The only parameter at this point that can be varied within a range of probable answers are Manning's coefficients for the different material types. This is done by setting the roughness to be a negative number in the [[WMS:Area Property Coverage#Material Properties|''HEC-RAS Materials'']] dialog. This negative number is a key number and should be unique for each stochastic variable created. When running the stochastic simulation WMS will substitute the simulation specific parameter for the defined key. Then setup a stochastic variable for HEC-RAS in the ''Stochastic Run Parameters'' dialog. A key value (matching the key defined in the materials property) starting value, minimum value, maximum value, standard deviation and distribution type. | The only parameter at this point that can be varied within a range of probable answers are Manning's coefficients for the different material types. This is done by setting the roughness to be a negative number in the [[WMS:Area Property Coverage#Material Properties|''HEC-RAS Materials'']] dialog. This negative number is a key number and should be unique for each stochastic variable created. When running the stochastic simulation WMS will substitute the simulation specific parameter for the defined key. Then setup a stochastic variable for HEC-RAS in the ''Stochastic Run Parameters'' dialog. A key value (matching the key defined in the materials property) starting value, minimum value, maximum value, standard deviation and distribution type. | ||
===Step 3. Establish appropriate | ===Step 3. Establish appropriate floodplain delineation parameters=== | ||
The floodplain delineation portion of the stochastic modeling uses the results from each HEC-RAS model to develop a floodplain for each run. The [[WMS:Overview of | The floodplain delineation portion of the stochastic modeling uses the results from each HEC-RAS model to develop a floodplain for each run. The [[WMS:Overview of Floodplain Delineation|floodplain delineation]] is the same model used by WMS to perform individual floodplain delineations. | ||
The only parameters at this point that can be varied within a range of probable answers the [[WMS:Delineate | The only parameters at this point that can be varied within a range of probable answers the [[WMS:Delineate Floodplain#Maximum Search Radius|search radius]] of the floodplain delineation. This is done by setting the search radius in the ''Floodplain Delineation Options'' be a negative number. This negative number is a key number and should be unique for each stochastic variable created. When running the stochastic simulation WMS will substitute the simulation specific parameter for the defined key. Then setup a stochastic variable for the floodplain in the ''Stochastic Run Parameters'' dialog. A key value (matching the key defined in the materials property) starting value, min value, max value, standard deviation and distribution type. | ||
===Step 4. Set up stochastic simulation parameters=== | ===Step 4. Set up stochastic simulation parameters=== | ||
There are several simulation parameters that control a stochastic simulation. They are defined in the ''Stochastic Run Parameters'' dialog shown below. Each section of this dialog is discussed below. | There are several simulation parameters that control a stochastic simulation. They are defined in the ''Stochastic Run Parameters'' dialog shown below. Each section of this dialog is discussed below. | ||
[[Image:StochasticRunParameters3.jpg|thumb|none|left| | :[[Image:StochasticRunParameters3.jpg|thumb|none|left|450 px|''Stochastic Run Parameters'' dialog]] | ||
====Simulation Type==== | ====Simulation Type==== | ||
The simulation type and number of simulations can be set. In a Monte Carlo simulation, each specified input variable is randomly varied within a specified minimum and maximum value a given number of times. If only a few simulations are run it may not be guaranteed to fully explore the parameter space. A Latin Hypercube simulation, on the other hand, divides the range into intervals and insures that parameters are chosen from each interval. With this kind of simulation | The simulation type and number of simulations can be set. In a Monte Carlo simulation, each specified input variable is randomly varied within a specified minimum and maximum value a given number of times. If only a few simulations are run it may not be guaranteed to fully explore the parameter space. A Latin Hypercube simulation, on the other hand, divides the range into intervals and insures that parameters are chosen from each interval. With this kind of simulation, it is easier to explore the parameter space with fewer simulations. | ||
====Stochastic Models==== | ====Stochastic Models==== | ||
HEC-1 or TR-20 for hydrologic modeling, HEC-RAS for hydraulic modeling, and Floodplain Delineation are the only currently available models for stochastic modeling. For each model including a basin input file, a solution files directory needs to be defined. For HEC-1, TR-20, or HEC-RAS, select the input file of the already created model. These models will have key values (negative numbers) for the input parameters that will be defined as stochastic variables. The current floodplain delineation options will be saved in the flood run file. | HEC-1 or TR-20 for hydrologic modeling, HEC-RAS for hydraulic modeling, and Floodplain Delineation are the only currently available models for stochastic modeling. For each model including a basin input file, a solution files directory needs to be defined. For HEC-1, TR-20, or HEC-RAS, select the input file of the already created model. These models will have key values (negative numbers) for the input parameters that will be defined as stochastic variables. The current floodplain delineation options will be saved in the flood run file. | ||
Add stochastic variables for any of the models. Each stochastic variable requires a key value (a negative number that has been entered in place of a parameter such as precipitation), a type, a starting value, a minimum value, a maximum value, a standard deviation, and a distribution. The distribution can be either normal or uniform and optionally defined as log. | |||
===Step 5. Assign boundary conditions between models | ===Step 5. Assign boundary conditions between models=== | ||
The final step before running a stochastic simulation is to link any required models. In particular, it's necessary to link how the hydrologic modeling results are used as boundary conditions for the HEC-RAS hydraulic model. When choosing the '''Run Stochastic Model''' command, the ''Model Steering Dialog'' appears. For the hydrologic model | The final step before running a stochastic simulation is to link any required models. In particular, it's necessary to link how the hydrologic modeling results are used as boundary conditions for the HEC-RAS hydraulic model. When choosing the '''Run Stochastic Model''' command, the ''Model Steering Dialog'' appears. For the hydrologic model (HEC-1), assign the appropriate hydrograph (basin or outlet) to the river reach and section in the hydraulic model. | ||
The option to ''Assign Hydrographs Automatically'' can be used providing a drainage coverage and centerline coverage are being used to set up the hydrologic and hydraulic models. | The option to ''Assign Hydrographs Automatically'' can be used providing a drainage coverage and centerline coverage are being used to set up the hydrologic and hydraulic models. | ||
| Line 48: | Line 49: | ||
When selecting '''OK''' the model simulation will run. | When selecting '''OK''' the model simulation will run. | ||
[[Image:WMS ModelSteering.jpg|thumb|none|left| | :[[Image:WMS ModelSteering.jpg|thumb|none|left|350 px|''Model Steering'' dialog]] | ||
===Step 6. Run the simulation=== | ===Step 6. Run the simulation=== | ||
[[Image:StochasticHEC-1.jpg|thumb| | [[Image:StochasticHEC-1.jpg|thumb|400 px|''Stochastic HEC-1'' dialog]] | ||
Once the simulation begins running, | Once the simulation begins running, notice the parameters selected for each model run, as well as the status of each run. The ''Read solution on exit'' toggle is on by default and will cause that all model solutions (hydrographs, water surface elevations, and floodplain delineations) are read when the simulations are completed. | ||
===Step 7. Post Process the results=== | ===Step 7. Post Process the results=== | ||
| Line 61: | Line 62: | ||
A series of hydrographs are loaded for each hydrograph station and can be viewed in the normal way hydrographs are viewed. | A series of hydrographs are loaded for each hydrograph station and can be viewed in the normal way hydrographs are viewed. | ||
[[Image:HydrographStationPlot.jpg|thumb|none|left| | :[[Image:HydrographStationPlot.jpg|thumb|none|left|350 px|A ''Plot'' window showing a hydrograph for a given hydrograph station.]] | ||
====Floodplains==== | ====Floodplains==== | ||
Each floodplain delineation results in a water surface elevation and a flood depth dataset. Each pair of datasets are organized in a folder underneath the TIN in the | Each floodplain delineation results in a water surface elevation and a flood depth dataset. Each pair of datasets are organized in a folder underneath the TIN in the Project Explorer. Set the contour options for a TIN and select the dataset to be active and displayed from the Project Explorer. | ||
:<gallery mode="packed" heights="300 px"> | |||
Image:DatasetPairs.png| | |||
Image:FlooplainContours.jpg| | |||
</gallery> | |||
====Probabilistic Floodplain Boundary==== | ====Probabilistic Floodplain Boundary==== | ||
A final dataset showing the probability of flooding is also created from all of the individual floodplain datasets. The probabilistic | A final dataset showing the probability of flooding is also created from all of the individual floodplain datasets. The probabilistic floodplain indicates for each vertex on the TIN the percentage of model runs that resulting in inundation at the point. | ||
:<gallery mode="packed" heights="300 px"> | |||
Image:ProbalisticFloodplainBoundary.jpg| | |||
Image:ProbalisticFloodplanInundation.jpg|Close up view | |||
</gallery> | |||
====Annual Exceedance Probability (AEP) Map==== | ====Annual Exceedance Probability (AEP) Map==== | ||
When using the stochastic hydrologic/hydraulic/floodplain delineation tools it is possible to generate an annual exceedance probability map. This is done by generating inundation maps that consider the range of all possible floods for all return periods. The result is a map that identifies the annual exceedance probability of flooding for every TIN vertex. For example if a point is flooded 10 times in 1000 simulations then it would represent the .01 probability. The '''Return Period → Feature Objects...''' command allows generating contours from the AEP map for specified return periods. Remember that such a map does not represent a solution from a single set of input parameters, but is rather the composite of several hundred or thousand simulations. | When using the stochastic hydrologic/hydraulic/floodplain delineation tools it is possible to generate an annual exceedance probability map. This is done by generating inundation maps that consider the range of all possible floods for all return periods. The result is a map that identifies the annual exceedance probability of flooding for every TIN vertex. For example if a point is flooded 10 times in 1000 simulations then it would represent the .01 probability. The '''Return Period → Feature Objects...''' command allows generating contours from the AEP map for specified return periods. Remember that such a map does not represent a solution from a single set of input parameters, but is rather the composite of several hundred or thousand simulations. | ||
== | :<gallery mode="packed" heights="300"> | ||
Image:AEPMAP.jpg| | |||
Image:ProbalisticFlood.jpg| | |||
</gallery> | |||
==Related Topics== | |||
*[[WMS:HEC-1 Run Analysis|HEC-1 Modeling]] | *[[WMS:HEC-1#Run Analysis|HEC-1 Modeling]] | ||
*[[WMS:Hydraulic Modeling|HEC-RAS Modeling]] | *[[WMS:Hydraulic Modeling|HEC-RAS Modeling]] | ||
*[[WMS:Overview of | *[[WMS:Overview of Floodplain Delineation|Floodplain Delineation]] | ||
{{WMSMain}} | {{WMSMain}} | ||
[[Category:WMS Modeling|S]] | [[Category:WMS Modeling|S]] | ||
[[Category:Stochastic| | [[Category:Stochastic|Stochastic WMS]] | ||
[[Category:WMS Dialogs | [[Category:WMS Stochastic Dialogs]] | ||
[[Category:Hydraulic Dialogs]] | |||
[[Category:Gallery]] | |||
Latest revision as of 20:24, 12 December 2023
There is always a great deal of uncertainty in hydrologic and hydraulic modeling and the parameters that are used to develop solutions. Despite this, a typical floodplain boundary is black and white in that the project is either in or out of the floodplain. A good engineer might be able to dispute a floodplain boundary by performing a hydrologic/hydraulic analysis with a set of equally probable parameters that results in a difference in the floodplain delineation. Until recently, computer programs lacked the ability to consider multiple probable answers and report a probabilistic floodplain boundary, but with the Stochastic Modeling tools in WMS this is possible using a combination of HEC-1 for hydrologic analysis, HEC-RAS for 1D hydraulic river modeling, and the WMS floodplain delineation tools.
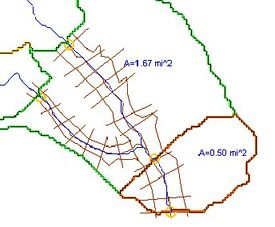
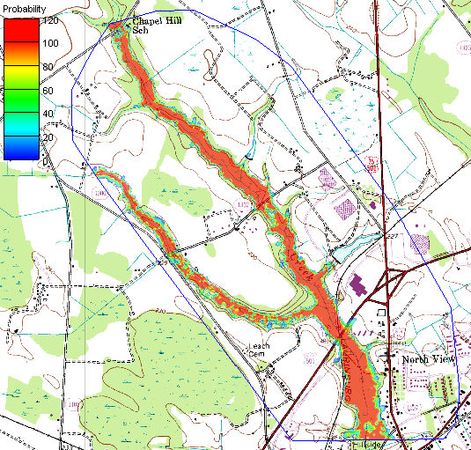
It is possible to connect the results of HEC-1 to a developed HEC-RAS model and then run them as many times consecutively, with the results of the HEC-1 analysis feeding the boundary conditions for an HEC-RAS model. Certain parameters (at this point only basin CN and precipitation within HEC-1, and Manning's roughness within HEC-RAS) can be varied within a range of reasonable values using Monte Carlo or Latin Hypercube simulations in order to create a number of simulations. The results of each HEC-RAS model can then be used to delineate a series of floodplains. The combination of all floodplains can then be examined in order to derive a "probabilistic" floodplain where a region flooded by 100% of the model simulation combinations can be distinguished from an area that is flooded by only 50% of the models as shown in the figure below:
The following steps outline the process for developing a stochastic model of floodplain boundaries using WMS, HEC-1, and HEC-RAS.
Step 1. Develop a hydrologic model with HEC-1
The HEC-1 Interface tools in WMS can be used to develop a working HEC-1 model. It is important that this model be running effectively (i.e. calibrated and/or adjusted to give credible results) prior to using it for the Stochastic Modeling simulation.
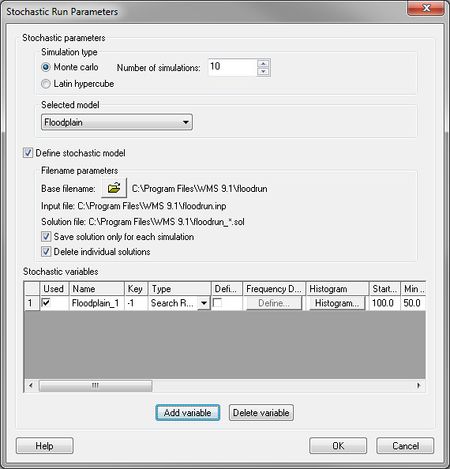
The only parameters at this point that can be varied within a range of probable answers are rainfall and CN (curve number for the different basins. This is done by setting the precipitation or CN to be a negative number in their respective dialogs. This negative number is a key number and should be unique for each stochastic variable created. When running the stochastic simulation WMS will substitute the simulation specific parameter for the defined key. Then setup a stochastic variable for HEC-1 in the Stochastic Run Parameters dialog. A key value (matching the key defined in the materials property) starting value, min value, max value, standard deviation and distribution type.
Step 2. Develop a working model in HEC-RAS
The HEC-RAS interface tools in WMS can be used to developing a working HEC-RAS model. It is important that this model be running effectively (i.e. calibrated and/or adjusted to give credible results) prior to using it for the Stochastic Modeling simulation.
The only parameter at this point that can be varied within a range of probable answers are Manning's coefficients for the different material types. This is done by setting the roughness to be a negative number in the HEC-RAS Materials dialog. This negative number is a key number and should be unique for each stochastic variable created. When running the stochastic simulation WMS will substitute the simulation specific parameter for the defined key. Then setup a stochastic variable for HEC-RAS in the Stochastic Run Parameters dialog. A key value (matching the key defined in the materials property) starting value, minimum value, maximum value, standard deviation and distribution type.
Step 3. Establish appropriate floodplain delineation parameters
The floodplain delineation portion of the stochastic modeling uses the results from each HEC-RAS model to develop a floodplain for each run. The floodplain delineation is the same model used by WMS to perform individual floodplain delineations.
The only parameters at this point that can be varied within a range of probable answers the search radius of the floodplain delineation. This is done by setting the search radius in the Floodplain Delineation Options be a negative number. This negative number is a key number and should be unique for each stochastic variable created. When running the stochastic simulation WMS will substitute the simulation specific parameter for the defined key. Then setup a stochastic variable for the floodplain in the Stochastic Run Parameters dialog. A key value (matching the key defined in the materials property) starting value, min value, max value, standard deviation and distribution type.
Step 4. Set up stochastic simulation parameters
There are several simulation parameters that control a stochastic simulation. They are defined in the Stochastic Run Parameters dialog shown below. Each section of this dialog is discussed below.
Simulation Type
The simulation type and number of simulations can be set. In a Monte Carlo simulation, each specified input variable is randomly varied within a specified minimum and maximum value a given number of times. If only a few simulations are run it may not be guaranteed to fully explore the parameter space. A Latin Hypercube simulation, on the other hand, divides the range into intervals and insures that parameters are chosen from each interval. With this kind of simulation, it is easier to explore the parameter space with fewer simulations.
Stochastic Models
HEC-1 or TR-20 for hydrologic modeling, HEC-RAS for hydraulic modeling, and Floodplain Delineation are the only currently available models for stochastic modeling. For each model including a basin input file, a solution files directory needs to be defined. For HEC-1, TR-20, or HEC-RAS, select the input file of the already created model. These models will have key values (negative numbers) for the input parameters that will be defined as stochastic variables. The current floodplain delineation options will be saved in the flood run file.
Add stochastic variables for any of the models. Each stochastic variable requires a key value (a negative number that has been entered in place of a parameter such as precipitation), a type, a starting value, a minimum value, a maximum value, a standard deviation, and a distribution. The distribution can be either normal or uniform and optionally defined as log.
Step 5. Assign boundary conditions between models
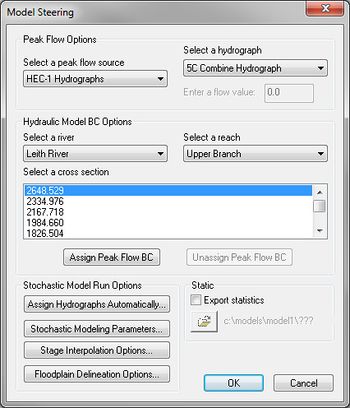
The final step before running a stochastic simulation is to link any required models. In particular, it's necessary to link how the hydrologic modeling results are used as boundary conditions for the HEC-RAS hydraulic model. When choosing the Run Stochastic Model command, the Model Steering Dialog appears. For the hydrologic model (HEC-1), assign the appropriate hydrograph (basin or outlet) to the river reach and section in the hydraulic model.
The option to Assign Hydrographs Automatically can be used providing a drainage coverage and centerline coverage are being used to set up the hydrologic and hydraulic models.
After identifying the hydrograph and the river, reach, and cross section station select the Assign Hydrograph BC button to link the models for this point. Continue until all of the appropriate model locations are linked.
When selecting OK the model simulation will run.
Step 6. Run the simulation
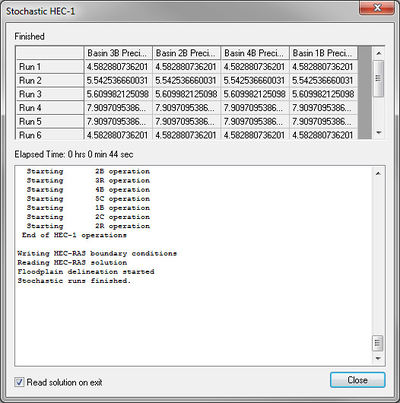
Once the simulation begins running, notice the parameters selected for each model run, as well as the status of each run. The Read solution on exit toggle is on by default and will cause that all model solutions (hydrographs, water surface elevations, and floodplain delineations) are read when the simulations are completed.
Step 7. Post Process the results
After finishing a stochastic simulation there are two primary results read back into WMS for each simulation: hydrographs from the HEC-1 model, and the floodplain depths and water surface elevations for each run.
Hydrographs
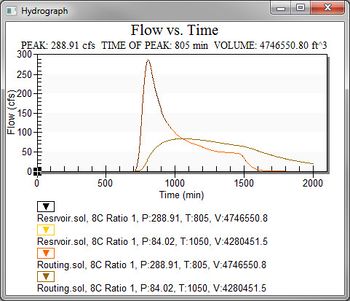
A series of hydrographs are loaded for each hydrograph station and can be viewed in the normal way hydrographs are viewed.
Floodplains
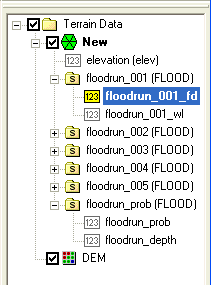
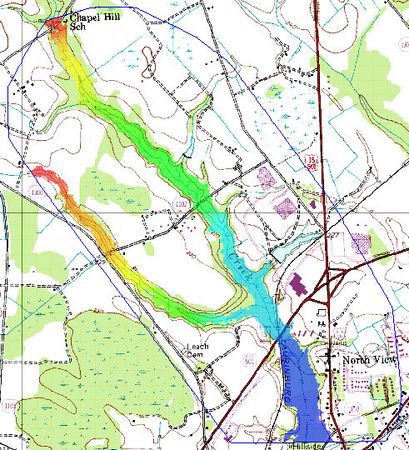
Each floodplain delineation results in a water surface elevation and a flood depth dataset. Each pair of datasets are organized in a folder underneath the TIN in the Project Explorer. Set the contour options for a TIN and select the dataset to be active and displayed from the Project Explorer.
Probabilistic Floodplain Boundary
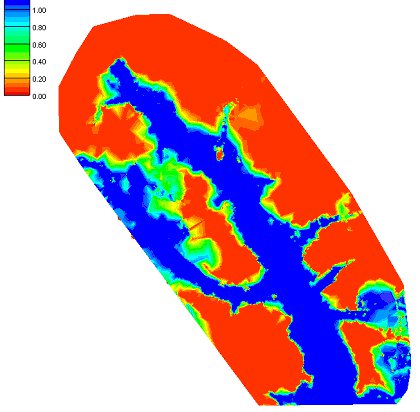
A final dataset showing the probability of flooding is also created from all of the individual floodplain datasets. The probabilistic floodplain indicates for each vertex on the TIN the percentage of model runs that resulting in inundation at the point.
Annual Exceedance Probability (AEP) Map
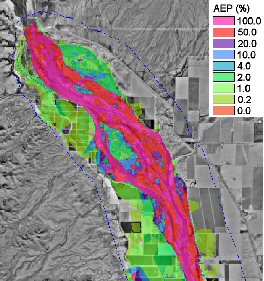
When using the stochastic hydrologic/hydraulic/floodplain delineation tools it is possible to generate an annual exceedance probability map. This is done by generating inundation maps that consider the range of all possible floods for all return periods. The result is a map that identifies the annual exceedance probability of flooding for every TIN vertex. For example if a point is flooded 10 times in 1000 simulations then it would represent the .01 probability. The Return Period → Feature Objects... command allows generating contours from the AEP map for specified return periods. Remember that such a map does not represent a solution from a single set of input parameters, but is rather the composite of several hundred or thousand simulations.
Related Topics
| [hide] WMS – Watershed Modeling System | ||
|---|---|---|
| Modules: | Terrain Data • Drainage • Map • Hydrologic Modeling • River • GIS • 2D Grid • 2D Scatter |  |
| Models: | CE-QUAL-W2 • GSSHA • HEC-1 • HEC-HMS • HEC-RAS • HSPF • MODRAT • NSS • OC Hydrograph • OC Rational • Rational • River Tools • Storm Drain • SMPDBK • SWMM • TR-20 • TR-55 | |
| Toolbars: | Modules • Macros • Units • Digitize • Static Tools • Dynamic Tools • Drawing • Get Data Tools | |
| Aquaveo | ||
