WMS:NSS Computing Peak Discharges: Difference between revisions
No edit summary |
|||
| Line 48: | Line 48: | ||
The following values are typically displayed in this field. | The following values are typically displayed in this field. | ||
{| | |||
|- | |||
|width="150"| | |||
*''Variable Name'' | *''Variable Name'' | ||
*''Abbreviation'' | *''Abbreviation'' | ||
*''Value'' | *''Value'' | ||
| | |||
*''Units'' | *''Units'' | ||
*''Minimum'' | *''Minimum'' | ||
*''Maximum'' | *''Maximum'' | ||
|} | |||
===Results=== | ===Results=== | ||
Revision as of 19:43, 10 June 2015
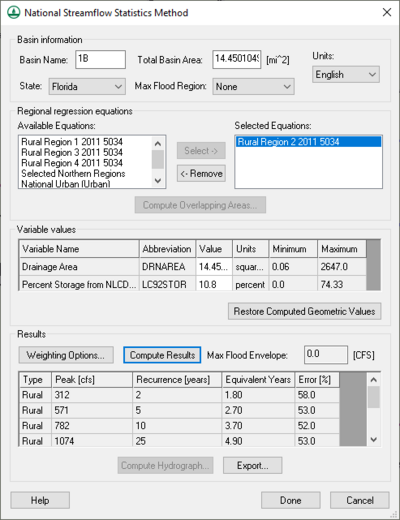
Setting up the analysis consists of the following steps, all done within the National Streamline Statistics Method dialog. The dialog can be used to do the follow:
- Delineate the watershed and compute the basin area and other geometric parameters. Enter the value manually if not having delineated from a DEM, drainage coverage, or TIN.
- Select the State the watershed is in and assign the Maximum Flood Region.
- Select the region equation that the watershed is in and while highlighted from the Available Equations window choose the Select button so that it will be listed in the Selected Equations window. If the watershed overlaps more than one region then select the other regions as well.
- Variable values derived from a DEM or Drainage coverage will automatically be placed in the appropriate edit fields. Other variables not computed will need to be defined.
- Select the Compute Results button to estimate the peak flows for the 2, 5, 10, 25, 50, 100 and 500-year recurrence intervals.
A hydrograph can be estimated by selecting one of the peak flow rows from the Results table and choosing the Compute Hydrograph button.
National Streamline Statistics Method Dialog Overview
The dialog is divided into four sections: Basin Information, Regional regression equations, Variable Values, and Results.
Basin Information
- Basin Name
Displays the basin ID by default. A different name can be manually entered if desired.
- Total Basin Area
The total basin area includes the area of all regions overlapped by the watershed. If a terrain model is used to compute areas, this value will be defaulted to the area computed for the selected basin.
- State
The NSS regression equations are separated by state. The State drop down menu is used to specify the state that the watershed is located in. Once the state is specified, the available regions will appear in the regional equations text window. Besides the 50 US states, an equation for Puerto Rico and a custom defined equation can be selected from the available choices.
- Max Flood Region
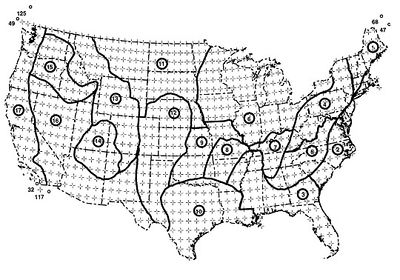
For comparison and evaluation, the NSS program compares each extrapolated 500-year flood peak discharge with the maximum flood-envelope curves given by Crippen and Bue (1977) and Crippen (1982). The map below shows the different flood regions, and should be used to determine the appropriate region for the watershed. A default value has been determined for each region, but this value may be overwritten.
- Units
Units can be displayed in either "English" or "Metric".
Regional Regression Equations
Each state is divided up into hydrologically similar regions with separate regression equations. Once the state is selected, the available regions appear in this section of the dialog.
- Available Equations
Lists all available regional regression equations for the selected State.
- Selected Equations
Lists all regional regression equations that have been selected.
- Select→
Moves selected equations from the Available Equations list to the Selected Equations list.
- ←Remove
Deletes a selected equation from the Selected Equations list.
- Compute Overlapping Areas
See NSS Overlapping Regions for more information.
Variable Values
As regions are selected in the Regional regression equations section, the relevant parameters for the regional equations are added to the Variable values spreadsheet. Parameters that can be computed by WMS are defaulted to their computed values at the time the regression equation is selected for use. A user may override defaulted values and later return to the computed values by clicking on the Restore Computed Geometric Values button.
Parameters not computed by WMS when computing basin data can sometimes be computed using the generic GIS Overlay calculator. This option (under the Calculators menu) can be used for example to determine the percentage of lake or forest cover from the drainage coverage and a land use layer.
The NSS program includes in its database the range of parameter values for the watersheds used in developing the regression equations. The applicable range, along with the expected units are displayed on the same row as the parameter edit field.
The following values are typically displayed in this field.
|
|
Results
- Weighting Options
- Compute Results
Estimate the peak flows for the 2, 5, 10, 25, 50, 100 and 500-year recurrence intervals.
- Max Flood Envelope
- Compute Hydrograph
A hydrograph can be estimated using the dimensionless hydrograph derived by the NSS program once peak flows have been computed. When computing a hydrograph a lag time must be defined. The lag time can be computed using either of the available methods in WMS, or by entering it manually.
- Export
Related Topics
WMS – Watershed Modeling System | ||
|---|---|---|
| Modules: | Terrain Data • Drainage • Map • Hydrologic Modeling • River • GIS • 2D Grid • 2D Scatter |  |
| Models: | CE-QUAL-W2 • GSSHA • HEC-1 • HEC-HMS • HEC-RAS • HSPF • MODRAT • NSS • OC Hydrograph • OC Rational • Rational • River Tools • Storm Drain • SMPDBK • SWMM • TR-20 • TR-55 | |
| Toolbars: | Modules • Macros • Units • Digitize • Static Tools • Dynamic Tools • Drawing • Get Data Tools | |
| Aquaveo | ||

