WMS:Coverage Overlays: Difference between revisions
No edit summary |
(No difference)
|
Revision as of 17:31, 12 November 2008
Overlaying two coverages is one of the most basic and powerful GIS operations for manipulating spatial data. WMS is a geographic information system (GIS) for hydrologic modeling, and to the extent that it performs "GIS" operations like overlay, it is used to establish specific hydrologic parameters like curve numbers (derived by overlaying a land use and soil coverage with the drainage coverage). However, there are a number of other useful overlays that may apply to hydrologic modeling that are not programmed into WMS. The Compute Coverage Overlay command in the Calculators menu allows you to overlay any two polygon coverages (such as land use and drainage boundaries) and derive information from them. For example you may want to know the percentage of a certain land use type (i.e. lakes, forest, pavement, etc.) covering your basins. These values are often needed for computations using the National Streamflow Statistics (NSS) program of regional regression equations.
Overlay areas (or percentages) are computed from the Compute Coverage Overlay dialog by first specifying the two coverages. The Input coverage is the coverage you are overlaying and want to determine values for. This is typically the drainage coverage because we usually want to know the area of land use or soil "overlaying" the basins and not the area of basins overlaying soils. You then specify the overlay coverage. If you wish to only use the selected polygons from the input coverage then check the toggle box.
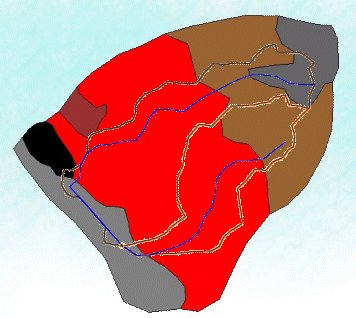
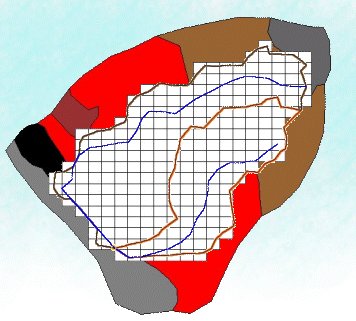
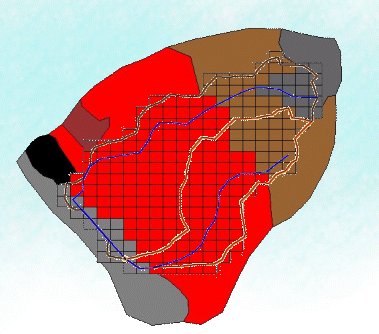
WMS does not perform a true vector overlay where lines from one coverage are intersected with the other and then a new set of polygons created. Instead a temporary or moving grid is placed over the two coverages and then each grid cell is sampled to see which polygons from the input and overlay coverages that it lies in as illustrated in the three figures below. The smaller the computation step the more accurate, but more time consuming the overlay calculations will be. WMS tries to estimate a reasonable size based on the overall area covered by the coverages, but you may need to adjust the computation step at times.
The Compute Overlay button performs the overlay calculations and the summary report (according to the options) is given in the text window of the dialog.
Related Topics
| [hide] WMS – Watershed Modeling System | ||
|---|---|---|
| Modules: | Terrain Data • Drainage • Map • Hydrologic Modeling • River • GIS • 2D Grid • 2D Scatter |  |
| Models: | CE-QUAL-W2 • GSSHA • HEC-1 • HEC-HMS • HEC-RAS • HSPF • MODRAT • NSS • OC Hydrograph • OC Rational • Rational • River Tools • Storm Drain • SMPDBK • SWMM • TR-20 • TR-55 | |
| Toolbars: | Modules • Macros • Units • Digitize • Static Tools • Dynamic Tools • Drawing • Get Data Tools | |
| Aquaveo | ||


