WMS:TR-20 Output Control: Difference between revisions
No edit summary |
No edit summary |
||
| Line 1: | Line 1: | ||
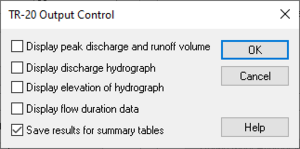
[[File:TR20outputcontrol.jpg|thumb|300 px|Example of the ''TR-20 Out Control'' dialog.]] | [[File:TR20outputcontrol.jpg|thumb|300 px|Example of the ''TR-20 Out Control'' dialog.]] | ||
For each hydrograph station (basin hydrographs, combined hydrographs, routed hydrographs, reservoir hydrographs, and diversion hydrographs) different output controls can be specified. Selecting the ''Output Control'' | For each hydrograph station (basin hydrographs, combined hydrographs, routed hydrographs, reservoir hydrographs, and diversion hydrographs) different output controls can be specified. Selecting the '''Output Control''' button from the individual hydrograph station dialog accesses this dialog. Entries that can be defined in this dialog are described below. | ||
==Peak Discharge and Runoff Volume== | ==Peak Discharge and Runoff Volume== | ||
Revision as of 17:21, 18 November 2014
For each hydrograph station (basin hydrographs, combined hydrographs, routed hydrographs, reservoir hydrographs, and diversion hydrographs) different output controls can be specified. Selecting the Output Control button from the individual hydrograph station dialog accesses this dialog. Entries that can be defined in this dialog are described below.
Peak Discharge and Runoff Volume
Selecting this option will output the following data at the selected hydrograph station(s):
- Peak discharge in cfs.
- Peak time in hours.
- Volume of water above constant base flow under the hydrograph in inches depth, acre-feet, and cfs-hours.
- Constant base flow value.
Discharge Hydrograph
Selecting this option will produce a discharge versus time hydrograph at the selected hydrograph station(s).
Elevation of Hydrograph
Selecting this option will produce an elevation versus time hydrograph in tabular form. This table will be produced for the hydrograph station(s) selected.
Flow Duration Data
Selecting this option will produce a table showing discharge versus duration of time that a discharge is equaled or exceeded. This table will be produced for the hydrograph station(s) selected.
Save Results for Summary Tables
This option puts the standard control operation results in summary tables 1 and 3 of the ECON2/URB1 generated files (see TR-20 reference manual). Only the largest peak discharge for each hydrograph is listed in these files.
Individual Basins and Reaches
Control of the output files can be specified individually for each of the reaches or outlets. The output control parameters for the inflow hydrograph corresponds to the ADDHYD record whereas the parameters for the outflow hydrograph correspond to the REACH record. Output control parameters for all hydrograph stations are identical and are discussed in an earlier section.
Related Topics
WMS – Watershed Modeling System | ||
|---|---|---|
| Modules: | Terrain Data • Drainage • Map • Hydrologic Modeling • River • GIS • 2D Grid • 2D Scatter |  |
| Models: | CE-QUAL-W2 • GSSHA • HEC-1 • HEC-HMS • HEC-RAS • HSPF • MODRAT • NSS • OC Hydrograph • OC Rational • Rational • River Tools • Storm Drain • SMPDBK • SWMM • TR-20 • TR-55 | |
| Toolbars: | Modules • Macros • Units • Digitize • Static Tools • Dynamic Tools • Drawing • Get Data Tools | |
| Aquaveo | ||
