WMS:Radar Rainfall
Overview
WMS 8.1 and later allows you to read and utilize radar rainfall data from the National Weather Service. You can use data with either the HMS or GSSHA hydrologic models.
Radar Rainfall with HMS
Steps to use Radar Rainfall with HMS
To use radar rainfall data with HMS, create an HMS model as you normally would. You can use the hydrologic modeling wizard. After you have created your model, define your precipitation in the HEC-HMS Meteorological Parameters dialog. Once you are here, you will need to do the following steps.
- Change precipitation method to either User Gage Weighting or Gridded Precipitation. "User Gage Weighting" will only allow you to create rain gages from the radar data, while "Gridded Precipitation" will allow you to create gridded precipitation in a DSS file as well as creating rain gages.
- To use "Gridded Precipitation", you must have a 2-D Grid defined.
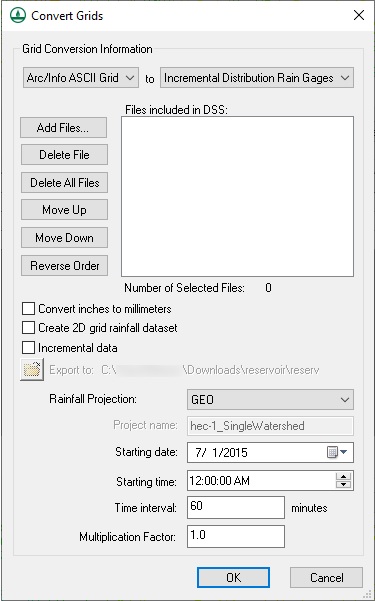
- Click on the button, which depending on your selection will be entitled Radar Data->Rain Gages... or Convert ASCII or XMRG files to DSS.... This will bring up the Convert Grids dialog.
- Obtain your rainfall data. You can follow the instructions on the GSDA site to obtain Nexrad Arc/Info ASCII grids.
- Select the datatype you want to convert your data to: Incremental Distribution Rain Gages, Total Storm Rain Gages, or DSS.
- Click Add Files.. and select your radar precipitation files.
- If you select the last file first, and select the first file while holding shift the data will come into WMS in the proper order.
- It is very important that you arrange the data in chronological order! Once you have brought the data into WMS, you can arrange the data's order through the use of the Move Up, Move Down, and Reverse Order.
- If you are using the suggested data from the NCDC website (link available at the GSDA site), then the filename has the date and time. The last numbers of the filename is the year, month, day, hour, and minute that the data was collected. For more information, please see NCDC Radar Frequently Asked Questions (FAQ).
- Note that the dialog can be resized to view the entire filename.
- If you are creating a DSS file, select the folder you wish to export the DSS file by clicking on the select folder button. You should also change the Project name.
- Select the starting date and time of the precipitation grids you are using.
- You can change the time interval of the rainfall grids by clicking on the HMS Job Control and changing the project's Time interval. The Rainfall timestep should match the project's timestep.
- If you wish to view the data in milimeters rather than inches, check the Convert inches to millimeters. If you are creating rain gages, then you may also create 2D grid rainfall dataset. This will allow you to visualize your data, but will take additional computational time. Selecting this option will also create a NEXRAD RADAR DATA SUMMARY REPORT with a basin average hyetograph.
- Click OK and wait for your computer to finish processing the radar rainfall data.
- Click OK to exit the HMS Meteorological Model dialog.
HMS Radar Rainfall Interface
Radar Rainfall with GSSHA
Steps to use Radar Rainfall with GSSHA
To use radar rainfall data with GSSHA, create an GSSHA model as you normally would. You can use the hydrologic modeling wizard. After you have created your model, define your precipitation in the GSSHA precipitation dialog. Once here, you will do the following steps to define Radar precipitation:
- Change your precipitation type to Nexrad Radar
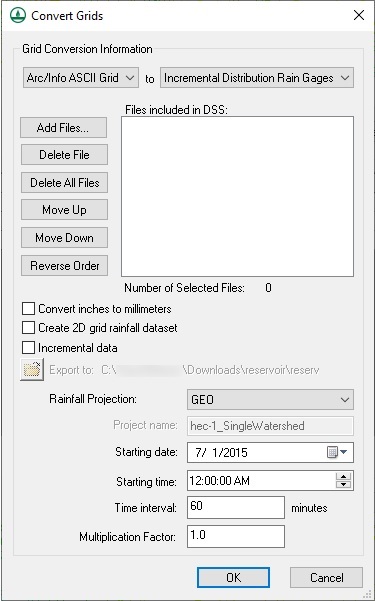
- Select Import Radar Data...
- Obtain your rainfall data by following the instructions on the GSDA site
- Select the Add Files... button
- Select the datatype you want to convert your data to: Incremental Distribution Rain Gages or Total Storm Rain Gages.
- Incremental Distribution Rain Gages corresponds to a GSSHA GAGE type rain gage.
- Total Storm Rain Gages corresponds to a GSSHA ACCUM type rain gage.
- Click Add Files.. and select your radar precipitation files.
- If you select the last file first, and select the first file while holding shift the data will come into WMS in the proper order.
- It is very important that you arrange the data in chronological order! Once you have brought the data into WMS, you can arrange the data's order through the use of the Move Up, Move Down, and Reverse Order.
- If you are using the suggested data from the NCDC website (link available at the GSDA site), then the filename has the date and time. The last numbers of the filename is the year, month, day, hour, and minute that the data was collected. For more information, please see NCDC Radar Frequently Asked Questions (FAQ).
- Note that the dialog can be resized to view the entire filename.
- Select the starting date and time of the precipitation grids you are using.
- You can change the time interval of the rainfall grids by clicking on the HMS Job Control and changing the project's Time interval. The Rainfall timestep should match the project's timestep.
- You should leave the toggle box Convert inches to millimeters checked. GSSHA will be expecting the precipitation in millimeters.
- If you wish to view the data as a 2D grid rainfall dataset, check the toggle box. This will allow you to visualize your data, but will take additional computational time. Selecting this option will also create a NEXRAD RADAR DATA SUMMARY REPORT with a basin average hyetograph.
- Click OK and wait for your computer to finish processing the radar rainfall data.
- Click OK to exit the HMS Meteorological Model dialog.
GSSHA Radar Rainfall Interface
What happens when I click OK in the Convert Grids dialog
This depends if you are converting to rain gages or Gridded Precipitation (including DSS). The following explains what occurs for each step of the process.
Rain Gages
- Read each radar file: This step will also convert the data from inches to millimeters, if that option is selected.
- Prepare Data: Sometimes the user will select data that stretches beyond one storm. The radar precipitation grids are cumulative, but only for the storm duration. After the defined storm has passed, the grids reset to zero. This step will make the grids cumulative for the time period selected by the user. Please note that it takes at least 0.5% of the grid to be less than the previous grid to be counted as a reset. WMS will not be tricked by a few incorrect values in the grid.
- Create Initial Grid: If the user does not select the first timestep of the storm, the first grid will contain precipitation that did not occur during the time period selected by the user. This step creates a copy of the initial values of the data selected by the user.
- Remove Initial Grid: This step removes the precipitation from all the timesteps that occurred prior to the first time step selected by the user.
- Converting grid to features: This step finds which points lie within the basin, and then creates a rain gage at that location. This step does not read any values for these gages.
- Assign time series Data: This step assigns values to each rain gage.
Gridded Precipitation (including DSS)
- Read each radar file: This step will also convert the data from inches to millimeters, if that option is selected.
- Prepare Data: Sometimes the user will select data that stretches beyond one storm. The radar precipitation grids are cumulative, but only for the storm duration. After the defined storm has passed, the grids reset to zero. This step will make the grids cumulative for the time period selected by the user. Please note that it takes at least 10% of the grid to be less than the previous grid to be counted as a reset. WMS will not be tricked by a few incorrect values in the grid.
- Create Initial Grid: If the user does not select the first timestep of the storm, the first grid will contain precipitation that did not occur during the time period selected by the user. This step creates a copy of the initial values of the data selected by the user.
- Remove Initial Grid: This step removes the precipitation from all the timesteps that occurred prior to the first time step selected by the user.
- Create 2D Scatter Set: This step finds which points lie within the basin, and then creates a 2D Scatter point at that location. This step does not read any values for these points.
- Assign 2D Scatter Set Data Values: This step assigns values to each 2D Scatter point for every time step.
- Interpolate #####.#### timestep: This step will convert the 2D Scatter Set to the 2D Grid. The process uses 2D scatter points to preserve accuracy to convert the precipitation grids because converting coordinate systems will change grid size and shape. Converting coordinate system through scatter points preserves the location and value of the measured precipitation. The most accurate way to convert this data back to a grid is through interpolation.
- Creating Incremental Dataset, in three steps: This step will convert the current cumulative rainfall dataset to an incremental dataset.
- Write 2D Grid dataset as ASCII Files for each timestep: This step is necessary to create a DSS file. The 2D grid Rainfall dataset is exported to a 2D Arc/Info ASCII Grid at the same location as the DSS file. Each timestep is exported separately. This step will create a command prompt for each timestep.
- Convert ASCII Grids to DSS file: This will take each grid exported in the last step and create a DSS file.
WMS – Watershed Modeling System | ||
|---|---|---|
| Modules: | Terrain Data • Drainage • Map • Hydrologic Modeling • River • GIS • 2D Grid • 2D Scatter |  |
| Models: | CE-QUAL-W2 • GSSHA • HEC-1 • HEC-HMS • HEC-RAS • HSPF • MODRAT • NSS • OC Hydrograph • OC Rational • Rational • River Tools • Storm Drain • SMPDBK • SWMM • TR-20 • TR-55 | |
| Toolbars: | Modules • Macros • Units • Digitize • Static Tools • Dynamic Tools • Drawing • Get Data Tools | |
| Aquaveo | ||

