WMS:Plot Windows
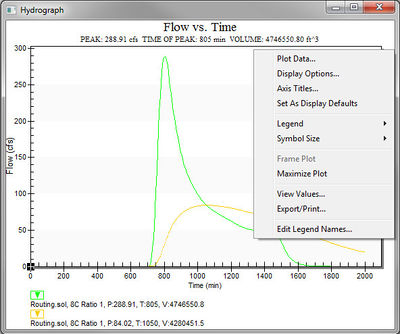
WMS uses a standard library for generating 2-dimensional plot data such as time series data and hydrographs. A plot window is often embedded within a dialog to display time series data such as rainfall distributions or storage capacity curves, but the primary use of Plot Windows are to display the hydrographs that result from hydrologic modeling simulations.
Display Options
The display options for a plot window, whether embedded in a dialog or used as a stand alone window for a hydrograph, are accessed by right-clicking the mouse in the plot window.
This is a standard menu provided by the plot library used in WMS, but not all of the menus will have effect on the plot. For example the Plot Data and Save Settings menus will not perform any action within WMS. The Display Options command will allow control of general, axis, font, color, etc. attributes of the plot. Axis titles can be set, and hydrograph units defined. Most useful though may be the Export/Print command which will allows exporting the plot data to a spreadsheet, or print the plot directly to a printer. Exporting can be to an image or text file and can be placed in a file or sent to the Windows clipboard for pasting.
Saving a Plot
Plots generated in a project can be saved as plot file. The plot file contains the parameters used to generate the plot for the specific project. To save a plot file:
- Generate a plot using the plot wizard.
- Before closing the plot, use the File | Save As menu command.
- In the Save As dialog, select "Plot File (*.plt)" as the File of Type.
If multiple plots have been generated, all of the plots will be saved in the plot file.
Plot files are imported using the File | Open command. When importing a plot file, it should be imported into the same or similar project where it was generated. WMS will look for a mesh and datasets that were specified for the plot display. If a mesh doesn't exist, WMS will look for another mesh that contains an appropriately named dataset. If the dataset doesn't exist in the folder named in the plot file, WMS will look for another dataset with a matching name in a different folder. If an observation coverage was used to generate the plot, then an observation coverage must also exist in the project when importing the plot file.
Currently, specified time steps are not saved.
Related Topics
WMS – Watershed Modeling System | ||
|---|---|---|
| Modules: | Terrain Data • Drainage • Map • Hydrologic Modeling • River • GIS • 2D Grid • 2D Scatter |  |
| Models: | CE-QUAL-W2 • GSSHA • HEC-1 • HEC-HMS • HEC-RAS • HSPF • MODRAT • NSS • OC Hydrograph • OC Rational • Rational • River Tools • Storm Drain • SMPDBK • SWMM • TR-20 • TR-55 | |
| Toolbars: | Modules • Macros • Units • Digitize • Static Tools • Dynamic Tools • Drawing • Get Data Tools | |
| Aquaveo | ||
