WMS:Datasets
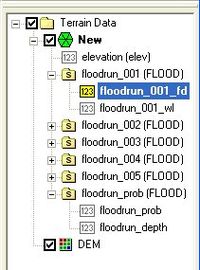
WMS was designed as a general purpose watershed modeling system. One of the main purposes of WMS is to provide a consistent interface for a variety of models and grid types. In order to accomplish this goal, input data for models and solution data (other than those models defined using topological trees) are handled in a simple, consistent fashion using datasets. They are accessed and managed using the Project Explorer as shown in the figure to the right.
A dataset is a set of values associated with each grid cell, or scatter point. A dataset can be steady state (one value per item) or transient (one value per item per time step). The following objects in WMS each have a scalar dataset list:
- TINs (elevations and solutions for floodplain delineation)
- 2D Grids (solutions for the GSSHA model)
- 2D Scatter Point Sets (could be a variety of things, but are used in WMS for storing hydraulic modeling water surface elevations that are used to delineate floodplains)
The commands for manipulating datasets are located in the Data menu of the respective modules, and as part of the Project Explorer where datasets are listed separately, or as part of solution folders.
Datasets are used for both pre- and post-processing of models. For example, a scalar dataset associated with a 2D grid can represent starting values of surface depth or values of hydraulic conductivity for a runoff modeling problem. Another dataset associated with the same grid may represent computed depth values. All datasets can be used to generate contours, color fringes, and animation sequences.
Active Dataset
The active dataset is specified by selecting it from the Project Explorer. Datasets may be stored in individual folders. In addition, if a transient dataset is highlighted, the time steps for the dataset are listed in the text box directly beneath the Project Explorer and one of the time steps is highlighted.
The values corresponding to the active dataset and time step are used whenever contour, or color fringe plots are generated. In addition, the entire range of time steps of the active dataset are used whenever animation film loops are generated. Whenever a new dataset is created by importing from a file, interpolating, or using the data calculator, the dataset becomes the active dataset for the object.
Data Calculator
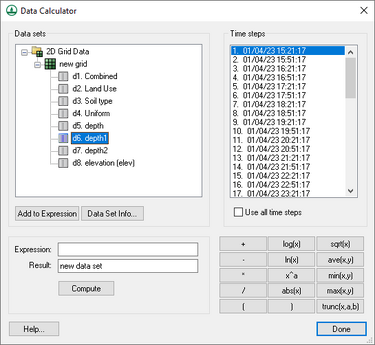
The Data Calculator can be used to perform mathematical operations with datasets to create new datasets. The Data Calculator is accessed by selecting the Data Calculator command from the Data or Edit menu.
- Performs mathematical calculations on scalar datasets
- Calculations can include any number of scalar datasets and user supplied numbers
- Useful for computing derived values such as Froude numbers
- Useful for comparing scalar datasets
Dataset Info
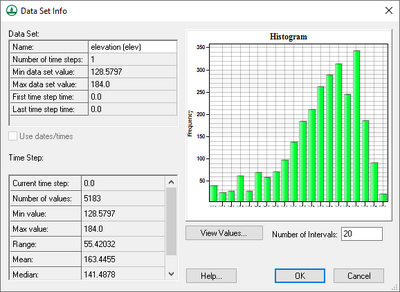
The Properties command, available when right-clicking on a dataset in the Project Explorer will bring up a dialog listing some of the main characteristics of the active scalar dataset. These include statistics such as maximum, minimum and range as well as mean and standard deviation. A histogram of the dataset is also generated and plotted in the dialog.
Deleting Datasets
Datasets can be deleted by selecting the dataset in the Project Explorer and selecting the Delete key on the keyboard. This deletes the binary copy of the dataset on disk. If the original dataset file was already in binary form, the file is not deleted.
Datasets that are part of solutions cannot be deleted unless the entire solution is deleted.
All datasets associated with an object are automatically deleted whenever the object is deleted or whenever the number of cells or vertices in the grid or scatter dataset is changed due to an editing command.
Elevations
Whenever a grid or scatter point set is created or read from a file, a scalar dataset is created containing the elevations of the cells or data points. Thus, there is always at least one dataset associated with each grid/TIN. This dataset cannot be deleted.
Mapping Elevations
For 2D grids it is often useful to change the values used for the elevations of the objects. For example, suppose a set of data values has been interpolated to a grid. The values can be displayed using contours. Another way to display the values is to map the dataset to the mesh elevations. This option further emphasizes the variation in the data when the grid is displayed in oblique view.
Any dataset can be mapped to elevations using the Map to Elevations command in the Data menu. The original elevations are always saved as a dataset so that the original elevations can be restored at a later time.
Solutions
Because some programs produce multiple datasets as part of a model run (GSSHA, stochastic modeling with floodplain delineation) it is convenient to be able to group all of the datasets together for reading, displaying, and managing. WMS uses the concept of a solution set which is collection of datasets for TINS or GRIDs and can also include hydrographs at single points. Solutions are identified in the Project Explorer as folders, with included datasets and provide another level of management for datasets.
Dataset Zonal Classification
The Dataset Zonal Classification function classifies one or two datasets into a single integer dataset (also known as an index map in GSSHA models).
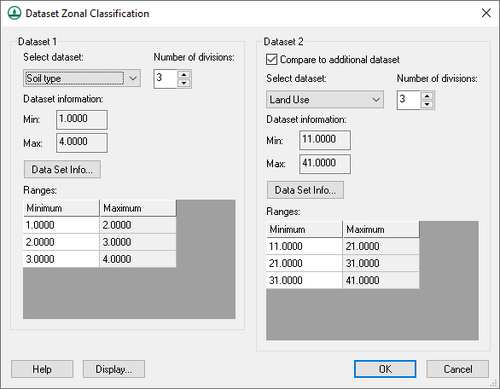
Sometimes, it's necessary to classify the results of one or two datasets to create a single index map. For example, if there is one dataset showing sediment erosion and a second dataset showing sediment deposition, it could be desired to find areas with high sediment erosion and low deposition or vice versa. The Dataset Zonal Classification tool helps to find these areas. When selecting the Dataset Zonal Classification command from the Data menu, the following dialog appears:
Modify the parameters in this dialog to generate the type of index map to be generated. The Select Dataset option allows selecting a dataset on the 2D grid. Changing the Number of divisions changes the number of minimum/maximum value pairs used to setup the dataset. After selecting a dataset, select the Dataset Info button to show the dataset properties. It is also possible edit the minimum values for each range. The minimum value for each range cannot be set above the maximum for the current range or below the minimum for the previous range.
If wanting to classify values in a single dataset, turn off the Compare to additional dataset option (this is turned off by default) and define zonal classifications and colors for 2 or more ranges of numbers.
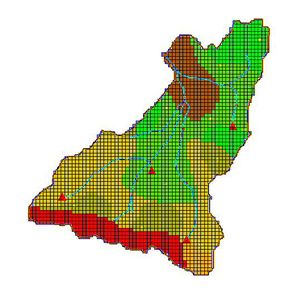
Clicking on the OK button generates a new index map with the name Classified, shown below. The colors are assigned to each grid cell in this dataset based on the colors specified in the Dataset Zonal Classification Display dialog.
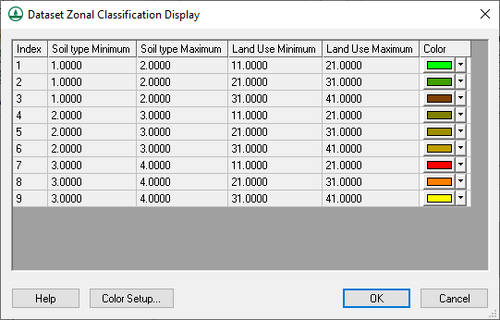
Clicking on the Display button allows viewing the index map values and set the colors for each set of ranges on each of the two datasets.
Dataset Zonal Classification Display
The Dataset Zonal Classification Display dialog is used to define the index map colors for each index map ID used when combining two datasets.
Either change individual colors or the colors for the color index values and the surrounding colors will be interpolated based on the index value colors. To change the index value colors, select the Color Setup button and define the colors used for low and high values of combinations of the one or two datasets that are selected.
Smooth Dataset
Sometimes it is desired to smooth elevation data or another dataset associated with a TIN. This may be because of a need to remove flat areas or other anomalies in the elevation dataset. When smoothing a dataset on the TIN, WMS runs a single iteration with a maximum change in elevation of 0.5 units and a filter ratio of 0.8. See Smoothing DEMs for more information about these variables.
There is also an option to smooth pits. This function automatically swaps edges and and adjusts coordinates to remove low spots on the TIN.
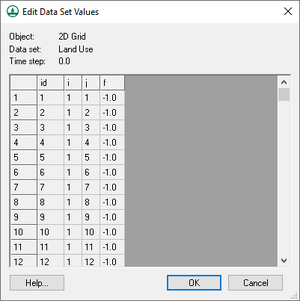
Edit Dataset Values
The Edit Dataset Values dialog is accessible by right-clicking on a dataset in the Project Explorer and selecting View Values.... At the top of the dialog, the following non-editable items are listed:
- Object – The type of object the dataset corresponds to (2D grid, scatter set, and so on).
- Dataset – The name of the dataset.
- Time step – The time step, if applicable.
Below that is a spreadsheet listing line items and their corresponding data. This information can vary, depending on the type of dataset selected.
At the bottom of the dialog are the following buttons:
- Help – Opens this article in a web browser.
- OK – Saves an changes made and closes the Edit Dataset Values dialog.
- Cancel – Discards and changes made and closes the Edit Dataset Values dialog.
Related Topics
WMS – Watershed Modeling System | ||
|---|---|---|
| Modules: | Terrain Data • Drainage • Map • Hydrologic Modeling • River • GIS • 2D Grid • 2D Scatter |  |
| Models: | CE-QUAL-W2 • GSSHA • HEC-1 • HEC-HMS • HEC-RAS • HSPF • MODRAT • NSS • OC Hydrograph • OC Rational • Rational • River Tools • Storm Drain • SMPDBK • SWMM • TR-20 • TR-55 | |
| Toolbars: | Modules • Macros • Units • Digitize • Static Tools • Dynamic Tools • Drawing • Get Data Tools | |
| Aquaveo | ||
