WMS:Interpolation Options
Scatter point sets are used for interpolation to other data types such as grids or basin centroids. Since no interpolation scheme is superior in all cases, several interpolation techniques are provided in WMS.
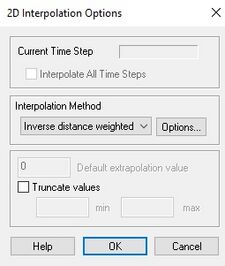
The interpolation option is selected using the Interpolation Options dialog accessed through the Interpolation Options command in the Interpolation menu. Once an option is selected, that option is used for all subsequent interpolation commands (interpolation of elevations from DEM/TIN to TINs or 2D Grids, floodplain delineation, etc.).
Interpolation is always performed using the active scatter point set or TIN. By default, the active dataset and time step are interpolated. The active dataset and time step can be selected from the Project Explorer or using the Dataset button at the top of the Interpolation Options dialog. This button also allows interpolation from all time steps of a transient dataset to be performed.
When interpolating a set of values, it is sometimes useful to limit the interpolated values to lie between a minimum and maximum value. For example, when interpolating rainfall values, a negative value of rainfall is meaningless. However, some interpolation schemes will produce negative values even if all of the scatter points have positive data values. This occurs in areas where the trend in the data is toward a zero value. The interpolation may extend the trend beyond a zero value into the negative range. In such cases, it is useful to limit the minimum interpolated value to zero. Interpolated values can be limited to a given range by selecting the Truncate values option in the Interpolation Options dialog and entering a minimum and maximum interpolation value.
The interpolation methods are listed in the Interpolation Options dialog. To the right of most of the method names is a button used to bring up a dialog for entering more interpolation options specific to the interpolation method. The methods supported for 2D interpolation are:
Interpolation of Rainfall to Basin Centroids
The Interpolate to Basin Precip command in the Interpolation menu is designed to interpolate rainfall values at scattered points to the XY series representing rainfall for a basin in either HEC-1 or TR-20. The scattered points typically represent either gaging stations or radar locations for NEXRAD data. Unlike interpolation to grids, this command does not use the active interpolation method, but rather uses the Thiessen method in order to assign the weights of each scatter point for each basin.
In addition to interpolating rainfall values to basin centroids, it is often convenient to interpolate the rainfall values to a grid so that an animation sequence of a storm can be generated. The Bounding Grid options described below are useful for setting up a grid for this purpose.
Interpolation to Grids
Once an interpolation scheme has been selected and all of the parameters for the selected scheme have been input, the data associated with the active time step and dataset of the active scatter point set can be interpolated to a grid. During the interpolation process, a new dataset is constructed for the grid containing the interpolated values.
The interpolation is done either to the grid nodes or to the grid cell centers depending on whether the grid is a mesh or a cell-centered grid.
Interpolation Options for Floodplain Delineation
Since stages are defined by a 2D scatter set, the same interpolation options are used for floodplain delineation as are used in the 2D Scatter module.
Related Topics
| [hide] WMS – Watershed Modeling System | ||
|---|---|---|
| Modules: | Terrain Data • Drainage • Map • Hydrologic Modeling • River • GIS • 2D Grid • 2D Scatter |  |
| Models: | CE-QUAL-W2 • GSSHA • HEC-1 • HEC-HMS • HEC-RAS • HSPF • MODRAT • NSS • OC Hydrograph • OC Rational • Rational • River Tools • Storm Drain • SMPDBK • SWMM • TR-20 • TR-55 | |
| Toolbars: | Modules • Macros • Units • Digitize • Static Tools • Dynamic Tools • Drawing • Get Data Tools | |
| Aquaveo | ||
