GMS:Rasters: Difference between revisions

From XMS Wiki
Jump to navigationJump to search
 
(23 intermediate revisions by 2 users not shown)
Line 1: Line 1:
{{GIS links}}
{{GIS links}}
DEMs (digital elevation models), and [[GMS:Images|images]] that include elevation data such as a [http://trac.osgeo.org/geotiff/ GeoTIFF], are referred to as "rasters". Using the third-party software [http://www.bluemarblegeo.com/global-mapper/ Global Mapper], GMS supports a large number of DEM formats. After importing, DEMs are listed under "GIS Data" in the Project Explorer along with other images. The raster icon [[File:Tree-raster-icon.png]] is different from the image icon [[File:Tree-Image-Icon.png]] to indicate it includes elevation data. Rasters don't have to be DEMs. For example, the values at the pixels can represent concentrations, or flow rates ... or anything.
DEMs (digital elevation models), and [[GMS:Images|images]] that include elevation data such as a [http://trac.osgeo.org/geotiff/ GeoTIFF], are referred to as "rasters". GMS supports a large number of DEM formats. After importing, DEMs are listed under "[[File:GIS Folder.svg|16 px]] GIS Layers" in the Project Explorer along with other images. The raster icon [[File:GIS Raster Icon.svg|16 px]] is different from the image icon [[File:GIS Image Icon.svg|16 px]] to indicate it includes elevation data. The values at the pixels can represent a wide variety of data, including (but not limited to) concentrations, elevations, or flow rates.


==Importing Rasters==
Line 8: Line 8:
Rasters can be created from within GMS by interpolating from [[GMS:2D_Scatter_Point_Module|2D scatter points]]. The [[GMS:2D_Interpolation_Options|interpolation options]], the raster cell size, and the extents of the raster can all be specified in the ''Scatter → Raster'' dialog.


==Interpolating From Rasters==
==Interpolating from Rasters==
Rasters can be interpolated to most other objects, including the z values of [[GMS:Feature_Objects|feature objects]] and to [[GMS:Interpolate_to_MODFLOW_Layers|MODFLOW layers]]. The interpolation is done by finding the raster cells that the object's points are in and assigning to the points the values from the raster cells.


Multiple rasters can be interpolated to another object at once by simply selecting multiple rasters in the Project Explorer, right-clicking and selecting the appropriate interpolation command. This will result in the creation of multiple datasets on the object being interpolated to. If the user desires to create only one dataset from all the rasters (because they are tiled next to each other, for example), the user can create a [[GMS:Raster_Catalog|raster catalog]] and interpolate from it.


==Conversion From Rasters==
==Conversion from Rasters==
Rasters can be converted to the following:
*[[GMS:2D_Grid_Module|2D grid]]
Line 24: Line 24:
*[[GIS_Conversion_and_Editing#Trimmed_Raster|Trimmed Raster]]


==Raster Display Options==
{{Raster Display Options}}
The GIS tab of the [[GMS:Display_Options|''Display Options'']] dialog is used to change the way rasters are displayed. DEMs are imported and displayed as either 2D images or as a 3D point cloud.
{{Image And Raster Projections}}
 
===Display as 2D image===
 
If displaying as a 2D image, the raster is only visible in plan view (like other images). This option is fast and memory efficient and can support large rasters (or several rasters). Hill shading, which enables shadows and thus makes the image appear 3D, is available in this mode.
 
===Display as 3D points===
 
If displaying as 3D points, the raster is visible in any view, not just plan view. 3D points are also very memory efficient but may be a little slower than the 2D image option. Also, hill shading is not available in this mode. The point size and the maximum number of points to display can be specified. Specifying a maximum number of points can be useful if the size of the raster is such that rendering becomes slow.
 
===Shaders===
 
With either 2D or 3D, four different shaders, which control the color ramp, are available. A color legend can be displayed to relate colors with values.


{{Navbox GMS}}
{{Navbox GMS}}
Line 45: Line 32:
[[Category:Raster]]
[[Category:Raster]]
[[Category:External Links]]
[[Category:External Links]]
[[Category:GIS]]

Latest revision as of 20:16, 24 May 2022

GIS Module
GIS
Enabling ArcObjects
Converting GIS Data to Other Data Types
GIS to Feature Objects
Add Data
More
GIS Display Options
GIS Tool Palette
Images
Rasters
Raster Catalogs
GIS Commands

DEMs (digital elevation models), and images that include elevation data such as a GeoTIFF, are referred to as "rasters". GMS supports a large number of DEM formats. After importing, DEMs are listed under "GIS Folder.svg GIS Layers" in the Project Explorer along with other images. The raster icon GIS Raster Icon.svg is different from the image icon GIS Image Icon.svg to indicate it includes elevation data. The values at the pixels can represent a wide variety of data, including (but not limited to) concentrations, elevations, or flow rates.

Importing Rasters

Rasters can be imported by simply opening the file(s) or dragging and dropping the file(s) into the GMS window. Multiple files can be imported at once. Rasters can also be obtained via the Get Online Maps feature.

Creating Rasters

Rasters can be created from within GMS by interpolating from 2D scatter points. The interpolation options, the raster cell size, and the extents of the raster can all be specified in the Scatter → Raster dialog.

Interpolating from Rasters

Rasters can be interpolated to most other objects, including the z values of feature objects and to MODFLOW layers. The interpolation is done by finding the raster cells that the object's points are in and assigning to the points the values from the raster cells.

Multiple rasters can be interpolated to another object at once by simply selecting multiple rasters in the Project Explorer, right-clicking and selecting the appropriate interpolation command. This will result in the creation of multiple datasets on the object being interpolated to. If the user desires to create only one dataset from all the rasters (because they are tiled next to each other, for example), the user can create a raster catalog and interpolate from it.

Conversion from Rasters

Rasters can be converted to the following:

Raster Display Options

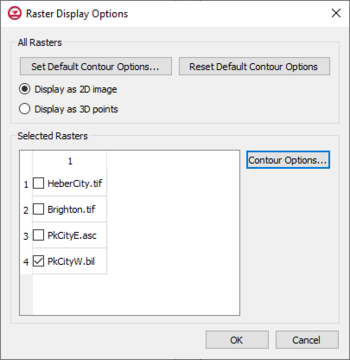
Example of the Raster Display Options dialog

The Raster Display Options dialog is used to change the way rasters are displayed. This dialog is accessed by right-clicking on a raster file in the Project Explorer and selecting the Display Options command.

DEMs are imported and displayed as either 2D images or as a 3D point cloud.

The Raster Display Options dialog has the following options:

  • Set Default Contour Options – This button will open a Contour Options dialog that will set contour options for all raster files in the project. Clicking the Color Ramp button in the Contour Options dialog will open the Color dialog. When accessing the Color dialog through this process, the differnet shader options are available.
  • Reset Default Contour Options – Clicking this will restore the contour options to the default options/factory condition.
  • Display as 2D Image – If displaying as a 2D image, the raster is only visible in plan view (like other images). This option is fast and memory efficient and can support large rasters (or several rasters). Hill shading, which enables shadows and thus makes the image appear 3D, is available in this mode.
  • Display as 3D Points – If displaying as 3D points, the raster is visible in any view, not just plan view. 3D points are also very memory efficient but may be a little slower than the 2D image option. Also, hill shading is not available in this mode. The point size and the maximum number of points to display can be specified. Specifying a maximum number of points can be useful if the size of the raster is such that rendering becomes slow.
  • Selected Rasters – This list will show all rasters that have been imported into the project.
    • Contour Options – This button will open a Contour Options dialog that will set contour options for the selected raster files in the project. Clicking the Color Ramp button in the Contour Options dialog will open the Color dialog. When accessing the Color dialog through this process, the differnet shader options are available.

Shaders

With either 2D or 3D, four different shaders, which control the color ramp, are available. A color legend can be displayed to relate colors with values. To view shading, use the Lighting display options.

Image And Raster Projections

Most raster data has a projection and coordinates (X, Y, and possibly Z locations of each raster cell) associated with it. The projection contains information about how to map the coordinates in the raster to actual horizontal and vertical locations on the surface of the earth.

Storing Projection Information

When loading an image or a raster, GMS, SMS, or WMS (referred to collectively as XMS) determines the horizontal projection using GDAL. This will be based on either a projection file (*.prj) or internal projection information in the raster.

If vertical projection information (vertical datum and units) is available for the image or raster, XMS reads the information and stores it internally.

If changing any projection information for a raster loaded into the a project, the XMS software saves a new raster in GeoTiff format.

Occasionally, a raster will exist that does not contain elevation data (for example, concentration values). In this case, XMS stores a metadata flag (read only by GMS, SMS, and WMS) with the raster stating that the raster does not have elevation units. When this metadata flag is found by XMS, none of the vertical values are reprojected after reading the raster.

XMS uses GeoTiffs to export rasters with horizontal and vertical projection information for use in other GIS programs.

When loading a raster, if there are no vertical units found in the raster, and the vertical values are treated as elevations, XMS prompts the user for the vertical units and exports a new raster as a GeoTiff. Also, if the vertical units do not match the horizontal units and the file being loaded is not a GeoTiff file, XMS prompts the user to confirm the vertical units and exports a new raster as a GeoTiff.

Saving Projection Information with a Raster

XMS imports rasters in a wide variety of supported formats. XMS exports rasters in either GeoTiff or Arc/Info ASCII Grid formats. No other formats are currently supported for exporting raster data.

When exporting a GeoTiff, the horizontal and vertical projection information is stored internally in the file. When saving an Arc/Info ASCII Grid file, the horizontal and vertical projection information is stored in a projection file (*.prj) and metadata file. All the necessary horizontal and vertical projection information is read into XMS (or other GIS programs such as ArcGIS) in these formats.