WMS:Interpolating Hydraulic Model Results: Difference between revisions
No edit summary |
No edit summary |
||
| Line 11: | Line 11: | ||
A user specifies either the centerline or the cross-sections by making it the active coverage in the Project Explorer prior to choosing this command. The following figure shows the result of interpolating along both the cross sections and the centerline of the model shown above. | A user specifies either the centerline or the cross-sections by making it the active coverage in the Project Explorer prior to choosing this command. The following figure shows the result of interpolating along both the cross sections and the centerline of the model shown above. | ||
[[ | [[File:InterpolatingHydraulicModelResults2.gif]] | ||
Revision as of 17:42, 2 April 2015
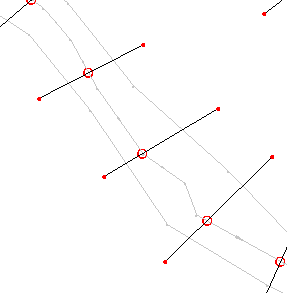
After running a 1D Hydraulic model like HEC-RAS, the result is a water surface elevation (or hydrograph for a dynamic solution) at the cross section as indicated by the red circles in the river section shown in the figure below.
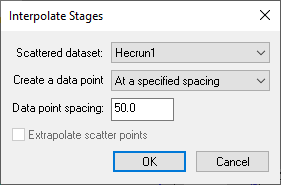
The flood plain delineation uses interpolation from the scatter set created by the hydraulic model solution, but the interpolation is not very accurate with such a sparse dataset (it often takes 6-8 points to interpolate and with such a sparse dataset these six or eight points could cover a long distance within the reach and result in a poor interpolation value). The Interpolate Water Surface Elevations command of the River Tools menu will interpolate for either the 1D-Hydraulic Centerline, or 1D-Hydraulic Cross-sections command new scatter points either at the vertices of the feature arcs (centerline or cross sections) or at a specified distance along the arcs.
Along cross sections the same value is used at every point along the cross section and along the centerline linearly interpolation is used between consecutive cross sections (this would be consistent with the assumption of a 1D hydraulic model that the water surface is linear between cross sections - if not more detail to the model should be added).
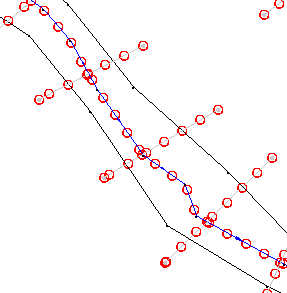
A user specifies either the centerline or the cross-sections by making it the active coverage in the Project Explorer prior to choosing this command. The following figure shows the result of interpolating along both the cross sections and the centerline of the model shown above.
Related Topics
WMS – Watershed Modeling System | ||
|---|---|---|
| Modules: | Terrain Data • Drainage • Map • Hydrologic Modeling • River • GIS • 2D Grid • 2D Scatter |  |
| Models: | CE-QUAL-W2 • GSSHA • HEC-1 • HEC-HMS • HEC-RAS • HSPF • MODRAT • NSS • OC Hydrograph • OC Rational • Rational • River Tools • Storm Drain • SMPDBK • SWMM • TR-20 • TR-55 | |
| Toolbars: | Modules • Macros • Units • Digitize • Static Tools • Dynamic Tools • Drawing • Get Data Tools | |
| Aquaveo | ||


