GMS:Coverages
Contents
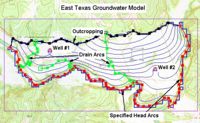
Feature objects in the Map module are grouped into coverages. Coverages are grouped into conceptual models.
A coverage is similar to a layer in a CAD drawing. Each coverage represents a particular set of information. For example, one coverage could be used to define recharge zones and another coverage could be used to define zones of hydraulic conductivity. These objects could not be included in a single coverage since polygons within a coverage are not allowed to overlap and recharge zones will typically overlap hydraulic conductivity zones.
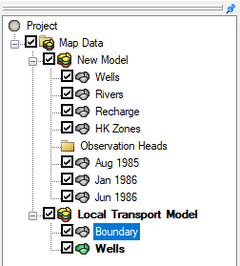
Coverages are managed using the Project Explorer. Coverages are organized below conceptual models. When GMS is first launched, no coverage exists. If no coverage exists and the user creates feature objects then a new coverage will automatically be created. When multiple coverages are created, one coverage is designated the "active" coverage. New feature objects are always added to the active coverage and only objects in the active coverage can be edited. The figure below shows several coverages in the Project Explorer. The active coverage is displayed with a color icon ![]() and bold text. Inactive coverages will have a grayed out icon
and bold text. Inactive coverages will have a grayed out icon ![]() . A coverage is made the active coverage by selecting it from the Project Explorer. In some cases it is useful to hide some or all of the coverages. The visibility of a coverage is controlled using the check box next to the coverage in the Project Explorer.
. A coverage is made the active coverage by selecting it from the Project Explorer. In some cases it is useful to hide some or all of the coverages. The visibility of a coverage is controlled using the check box next to the coverage in the Project Explorer.
A new coverage can be created by right-clicking on a folder or conceptual model and selecting the New Coverage command in the pop-up menu.
Coverage Right-Click Commands
Right-clicking on a coverage brings up a menu with the following options:
- Delete – Removes the selected coverage from the GMS project. Once deleted the coverage will have to be either loaded into GMS again if it came from a file or the coverage will have to be rebuilt.
- Duplicate – Creates a copy of the selected coverage in the Project Explorer. The duplicate coverage will have the word "Copy of..." affixed to the name of the copied coverage. Additional duplicates will have a number affixed to the name if the copied coverage is not renamed.
- Rename – Assigns a new name to the selected coverage.
- Coverage Setup – Brings up the Coverage Setup dialog.
- Attribute Table – Brings up the Attribute Table dialog.
- Map To submenu
- Transform
- Export
- Properties
Coverage Setup
The Coverage Setup command brings up the Coverage Setup dialog. This dialog controls the properties that are assigned to feature objects. The feature object properties have been divided into 3 general categories: Sources/Sinks/BCs, Areal Properties, and Observation Points. Under the Sources/Sinks/BCs the user can select which source/sinks he would like to include in the coverage (like wells, rivers, drains, etc). Areal Properties includes recharge, ET, hydraulic conductivity, and other properties that are assigned to polygonal zones. Observation Points control which datasets have associated observation data.
Feature Object Properties Categories
| Sources/Sinks/BCs |
|---|
|
| Areal Properties |
|---|
|
| Observation Points |
|---|
|
Note about the "Layer range" boundary condition option: the "Layer range" option can be used to apply a boundary condition over one or more layers. When turned on, three column fields are added to the boundary condition attribute table including "Auto assign layer", "From layer", and "To layer".
The Coverage type is used for WASH123D conceptual models to set the coverage to be a 3D or a 2D coverage.
The Default layer range is used with MODFLOW conceptual models to default the "from layer"/"to layer" assignments for boundary conditions.
The Use to define model boundary toggle is used with MODFLOW and MODAEM. This means that the polygons in this coverage are used to define the active area of the model. For no flow boundary cells a majority of the cell has to be within a polygon for it to be active. For specified head cells if any portion of the cell is inside a boundary polygon then it is activated.
3D Grid Layer Option for Observation Points
The 3D grid layer option for obs. pts. is used to set the input option for observations associated with MODFLOW conceptual models. The MODFLOW observation package can handle observations that include multiple cells. Three options are available for determining which layer the observation point will be located:
- by z location – When the "by z location" option is selected, the computed value for the observation point (that will be compared with the observed value) will be taken from the cell that corresponds with the elevation value assigned to the observation point.
- by layer number – If selecting the "by layer number" option in the coverage setup, the computed value will be taken from the cell that corresponds to the layer that is specified in the observation point coverage properties.
- Use well screen – This option may be used when the model includes wells with screens. GMS finds the cell or cells that intersect the screened interval the user has entered.
The Default elevation field can be used to define the initial Z elevation of new objects created in a coverage. By assigning a different elevation to each of the coverages, the coverages can be displayed as a stack of layers in oblique view.
Feature Object Attribute Table
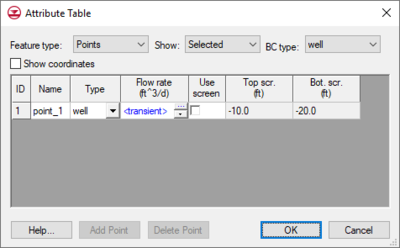
All feature object properties are edited using a single spreadsheet. This makes it possible to cut and paste feature object data using the clipboard and it makes it easier to edit entire columns of data at once. Filters at the top of the dialog control what type of objects are displayed.
The specific attributes available in this dialog vary depending on options selected in the Coverage Setup dialog.
Map To Submenu
Coverages can be mapped to other geometric objects or numerical models by selecting the corresponding command from the Map to submenu. Options include:
- Map to TIN
 – Creates a TIN using each polygon in the coverage.
 - Map to 2D Mesh
 – Creates a 2D Mesh on the interior of all of the polygons in the current coverage.
 - Map to 3D Grid
 – Opens the Create Grid dialog.
 - Map to UGrid
 – Creates a UGrid from feature objects.
 - Map to 2D Scatter
 – Creates a scatter point set from the points and nodes and vertices of the current coverage.
 - Map to MODFLOW
 – Converts a conceptual model to a MODFLOW numerical model.
 - Map to FEMWATER
 – Converts a conceptual model to a FEMWATER numerical model.
 - Map to MT3DMS
 – Converts a conceptual model to a MT3DMS numerical model.
 - Map to SEEP2D
 – Converts a conceptual model to a SEEP2D numerical model.
Merge Coverage
Multiple coverages can be merged in a new coverage. Do this by selecting two or more coverages using the Shift key, then right-click on the coverages and select the Merge command. A new coverage will be created in the Project Explorer. This merged coverage will contain all properties and feature objects that existed on each coverage used to create the merged coverage.
Coverage Properties
Right-click on a coverage and selecting the Properties command will open a Properties dialog. This dialog will contain information about the coverage, such as the number of feature objects and projection. The dialog also contains a Notes tab for saving comments or other notes about the coverage.
See also
| GMS – Groundwater Modeling System | ||
|---|---|---|
| Modules: | 2D Grid • 2D Mesh • 2D Scatter Point • 3D Grid • 3D Mesh • 3D Scatter Point • Boreholes • GIS • Map • Solid • TINs • UGrids | |
| Models: | FEFLOW • FEMWATER • HydroGeoSphere • MODAEM • MODFLOW • MODPATH • mod-PATH3DU • MT3DMS • MT3D-USGS • PEST • PHT3D • RT3D • SEAM3D • SEAWAT • SEEP2D • T-PROGS • ZONEBUDGET | |
| Aquaveo | ||


