WMS:Plot Wizard
The Plot Wizard is intended to streamline the preparation for a series of standard plots that can be generated after performing certain types of analysis. The first six plot types are related to the two-dimensional runoff model, GSSHA, where a series of results for the finite difference grid, and observed values exist. At this time they are still under development and will not be discussed in detail here.
Maricopa County Scatter Plot
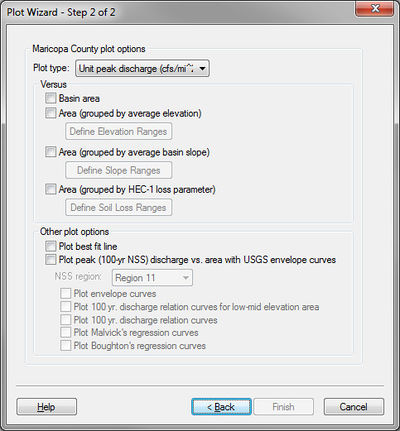
The Maricopa County Scatter Plot option was created specifically for reports generated by the Maricopa County Flood Control District, but these plots are useful for regularly working with HEC-1. These plots include the ability to plot peak discharges or unit peak discharges (cfs/mi2) against basin areas that can be grouped according to average elevations, slopes, or loss parameters. They can also be compared against several standard regression curves or best fit lines. After selecting the Maricopa County Scatter Plot option from the Plot Wizard the second step shows the following dialog:

The options for the plot are chosen from this dialog. A scatter point for the plot is created from each hydrograph icon (basins and outlets) in the model and then any other plot option lines are generated for reference.
FHWA Storm Drain HGL Plot
Results of a storm drain analysis can also be generated using the Plot Wizard. Hydraulic Grade Line vs. invert and/or ground elevations can be generated from the results of a Storm Drain analysis.

Related Topics
WMS – Watershed Modeling System | ||
|---|---|---|
| Modules: | Terrain Data • Drainage • Map • Hydrologic Modeling • River • GIS • 2D Grid • 2D Scatter |  |
| Models: | CE-QUAL-W2 • GSSHA • HEC-1 • HEC-HMS • HEC-RAS • HSPF • MODRAT • NSS • OC Hydrograph • OC Rational • Rational • River Tools • Storm Drain • SMPDBK • SWMM • TR-20 • TR-55 | |
| Toolbars: | Modules • Macros • Units • Digitize • Static Tools • Dynamic Tools • Drawing • Get Data Tools | |
| Aquaveo | ||