WMS:Graphical User Interface
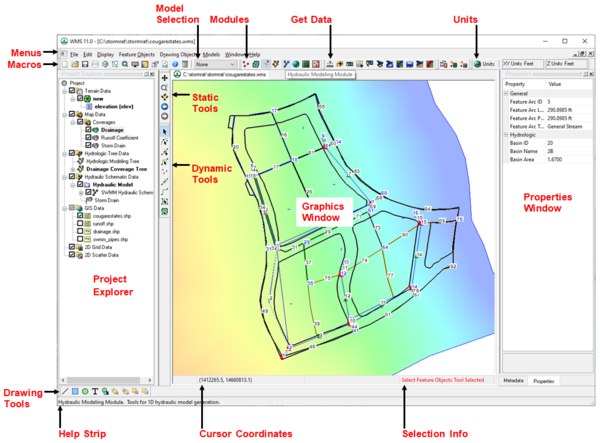
The WMS Graphical User Interface, or GUI, allows the user to easily manage any project within the Watershed Modeling System. It is divided into a number of sections, listed clockwise starting from the top left (see the image, right):
- Menus
- Macros
- Model Selection
- Modules
- Get Data
- Units
- Properties Winow
- Selection Info
- Cursor Coordinates
- Help Strip
- Drawing Tools
- Project Explorer
- Static and Dynamic Tools
- Graphics Window
Many of these can be separated from the main panel as floating windows, or re-docked in other locations using the double line "handle" at the left or top of the toolbar or panel.
Menu Bar
- Main page: WMS:Menu Bar
The Menu Bar collects various drop-down menus. Additional menus become available depending on which module or model are selected. For more details on these and other menus, see WMS:Menu Bar.
Macros Toolbar
- Main page: WMS:Macros
The Macros toolbar collects a number of standard Windows macros as well as several commonly-used commands within WMS.
Model Selection
- Main page: WMS:Model Selection
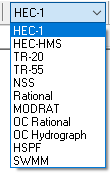
The Model Selection drop-down is (by default) located to the right of the Macros toolbar. It allows selection of models supported within the currently-selected module. Selecting a model causes its associated menu(s) to appear in the Menu Bar.
The following models, depending on the module selected, are available (listed alphabetically): CE-QUAL-W2, GSSHA, HEC-1, HEC-HMS, HEC-RAS, HSPF, MODRAT, NSS, OC Hydrograph, OC Rational, Rational, River Tools, SMPDBK, Storm Drain, Storm Drain-FHWA, SWMM, TR-20, TR-55.
See WMS:Model Selection for specifics on the menu options for each module.
Modules Toolbar
- Main page: WMS:Modules
The interface for WMS is divided into eight modules. A module is provided for each of the basic data types or modeling environments supported by WMS.
The following modules are supported in WMS:
 Terrain Data Module
 Drainage Module
 Map Module
 Hydrologic Modeling Module
 Hydraulic Modeling Introduction
 GIS Module
 2D Grid Module
 2D Scatter Point Module
Get Data Toolbar
- Main page: WMS:Get Data Toolbar
The Get Data toolbar allows the user to import data from a variety of online sources, obtain data from within a WMS project, and import previously-downloaded files from the user's computer.
The tools include:
 Measure – Measure the distance and slope along any user defined path if a TIN or DEM is present in the project.
 Add GIS Data – Opens an Add GIS Data dialog allowing opening of GIS files.
 Get Data From Map – Opens the Virtual Earth Map Locator dialog.
 Get Online Maps – Opens the Virtual Earth Map Locator dialog.
 Get Data – Requires existing data in the project and a projection. Drawing a selection box with this tool active opens the Data Service Options dialog.
 Hydrologic Modeling Wizard – Opens the Hydrologic Modeling Wizard dialog.
 HY-8 Modeling Wizard – Opens the HY-8 Modeling Wizard dialog.
 Hydraulic Toolbox – Launches the Hydraulic Toolbox.
 HY-8 – Launches HY-8.
 MWBM Modeling Wizard – Opens the MWBM Modeling Wizard dialog.
 Map Flood – Opens the Floodplain Mapping Options dialog.
Map Tools Macros Toolbar
The Map Tools Macros toolbar contains the following macros:
Units
- Main page: WMS:Units Toolbar
The Units toolbar displays the XY Units and Z Units for the project. The Units button on the toolbar opens the Units dialog.
Properties Window
- Main page: WMS:Properties Window
The Properties window display information about the selected entity in the Main Graphics Window, as well as allowing some of the attributes of the selected entity to be edited. See WMS:Properties Window for more details.
Bottom of the Window
There are three information sections at the bottom of the WMS window.
- Selection Info – Displays the name of the current active tool.
- Cursor Coordinates – Displays the X, Y, and Z coordinates of the cursor as it moves within the graphics window. If a projection is set, the global coordinates will also display according to the selected projection. See WMS:Coordinate Tracking for more details.
- Help Strip – Dsplays context sensitive help messages. See WMS:Help Strip for more details.
The Drawing Tools toolbar is located (by default) at the bottom left corner of the WMS window.
Project Explorer
- Main page: WMS:Project Explorer
The Project Explorer contains a hierarchical representation of the data associated with a modeling project. It allows the user to manage the data, including creation, visibility, or deletion of data objects. See WMS:Project Explorer for more details.
Static Tools
- Main page: WMS:Static Tool Palette
The Static Tools are commonly-used tools available regardless of which module is active. These include Pan, Zoom, Rotate, View Previous, and View Next. See WMS:Static Tool Palette for more details.
Dynamic Tool Palettes
- Main page: WMS:Dynamic Tool Palette
The dynamic tool palettes contain tools specific to each module, changing depending on which module is active. See WMS:Dynamic Tool Palette for more details.
Main Graphics Window
The Main Graphics Window, or simply "Graphics Window", displays the active project, allows the user to use tools and macros to manipulate the contents and change the view and perspective. The Display and contour options can be changed in order to hide or make visible any of the entities within the project, change symbol, arc, point, polygon, and text color, style, and thickness, label entities, and change the colors and transparency of contours used within the project.
Related Links
- Getting Started with WMS
- Menu Bar
- Edit Window
- Module Palette
- Tool Palette
- Macros
- Help Strip
- Project Explorer
WMS – Watershed Modeling System | ||
|---|---|---|
| Modules: | Terrain Data • Drainage • Map • Hydrologic Modeling • River • GIS • 2D Grid • 2D Scatter |  |
| Models: | CE-QUAL-W2 • GSSHA • HEC-1 • HEC-HMS • HEC-RAS • HSPF • MODRAT • NSS • OC Hydrograph • OC Rational • Rational • River Tools • Storm Drain • SMPDBK • SWMM • TR-20 • TR-55 | |
| Toolbars: | Modules • Macros • Units • Digitize • Static Tools • Dynamic Tools • Drawing • Get Data Tools | |
| Aquaveo | ||

