WMS:Rational Method Computing Hydrographs: Difference between revisions
| Line 30: | Line 30: | ||
:* ''r'' = Falling limb coefficient | :* ''r'' = Falling limb coefficient | ||
:* ''s<sub>d</sub>'' = Storm duration | :* ''s<sub>d</sub>'' = Storm duration | ||
==Dekalb Rational Hydrograph== | |||
The Dekalb Rational Hydrograph was developed by Dekalb County Georgia, and like the Universal Rational Hydrograph, ordinates are computed by scaling the peak discharge by an appropriate value. The time to peak occurs at ''5 * t<sub>c</sub>'', while the time base is ''10 * t<sub>c</sub>''. All coefficients occur at increments of ''t<sub>c</sub>'', and are different depending on whether ''t<sub>c</sub>'' is less than 20 minutes or not. The following table lists the coefficients and a typical hydrograph is shown below. | |||
{| Border=1 CellSpacing=0 CellPadding=2 | |||
|- | |||
| ColSpan=3 | | |||
{| Border=1 CellSpacing=0 CellPadding=2 style="background:#aaccff;" | |||
|- | |||
!Dimensionless Time and Hydrograph Ordinates | |||
|} | |||
|- style="background:#dfdfdf;" | |||
!''t''/''t<sub>c</sub>'' !!''Q''/''Q<sub>p</sub>'' for ''t<sub>c</sub>'' < 20 min !!''Q''/''Q<sub>p</sub>'' for ''t<sub>c</sub>'' >= 20 min | |||
|- Align=Center | |||
|0 ||0.00 ||0.00 | |||
|- Align=Center | |||
|1 ||0.16 ||0.04 | |||
|- Align=Center | |||
|2 ||0.19 ||0.08 | |||
|- Align=Center | |||
|3 ||0.27 ||0.16 | |||
|- Align=Center | |||
|4 ||0.34 ||0.32 | |||
|- Align=Center | |||
|5 ||1.00 ||1.00 | |||
|- Align=Center | |||
|6 ||0.45 ||0.30 | |||
|- Align=Center | |||
|7 ||0.27 ||0.11 | |||
|- Align=Center | |||
|8 ||0.19 ||0.05 | |||
|- Align=Center | |||
|9 ||0.12 ||0.03 | |||
|- Align=Center | |||
|10 ||0.00 ||0.00 | |||
|} | |||
:where: | |||
:* ''t<sub>c</sub>'' = Time of concentration. | |||
:* ''Q'' = Flow at time ''t'', in cfs. | |||
:* ''Q<sub>p</sub>'' = Peak flow. | |||
:[[Image:DekalbRationalHydrograph.png]] | |||
==Related Topics== | ==Related Topics== | ||
Revision as of 15:36, 11 December 2017
The Rational Method equation is designed to compute peak flows. However, a hydrograph, based on the peak flow and basin (or outlet) time of concentration, can be computed using one of five different unit hydrographs. Furthermore, there are two different methods (traditional and route by summing) hydrographs can be computed at confluence points.
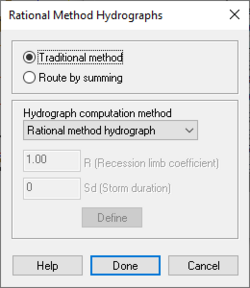
The Rational Method Hydrographs dialog is used to specify the dimensionless unit hydrograph method, and the way hydrographs at outlets are computed. The dialog can be accessed through the Rational Method dialog. Options include:
- Traditional method – Computes a peak flow at an outlet by determining composite C, tc, and areas from upstream basins and tributaries.
- Route by summing – Computes peak flows and hydrographs for basins in the traditional manner, but hydrographs at outlet points are determined by combining or summing the hydrographs from upstream basins and tributaries.
- Hydrographaph computation method
- "Rational Hydrograph" – See below.
- "Modified Rational Hydrograph" – When this option is chosen, the following options need to be defined.
- Recession limb coefficient
- Storm duration
- "Dekalb Rational Hydrograph"
- "Universal Rational Hydrograph"
- "User Defined Rational Hydrograph"
Rational Hydrograph
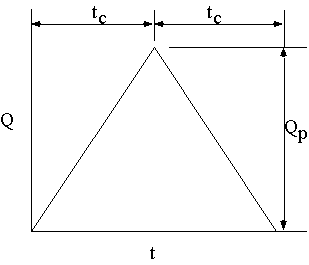
The Rational Unit Hydrograph has a time to peak equal to the time of concentration. Both the rising and receding limbs of the hydrograph have a duration equal to the time of concentration, and therefore the shape of the hydrograph is an isosceles triangle with a time base of 2tc as shown below. This method is chosen by specifying the Modified Hydrograph Method using 1.0 for the recession limb coefficient and tc for the storm duration.
Modified Rational Hydrograph
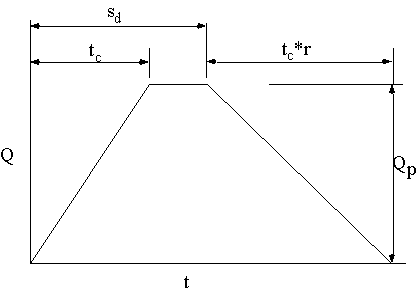
The Modified Rational Hydrograph also assumes that the time to peak is equal to the tc, but allows for the duration of the storm to be longer than tc, resulting in a trapezoidal shaped hydrograph as shown below. A coefficient to modify the slope of the receding limb may also be applied with this method.
- where:
- tc = Time of concentration.
- Q = Flow at time , in cfs.
- Qp = Peak flow.
- r = Falling limb coefficient
- sd = Storm duration
Dekalb Rational Hydrograph
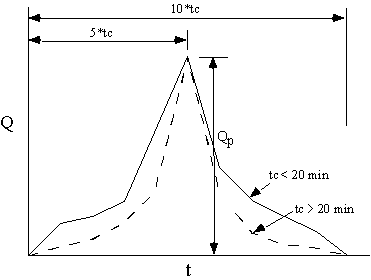
The Dekalb Rational Hydrograph was developed by Dekalb County Georgia, and like the Universal Rational Hydrograph, ordinates are computed by scaling the peak discharge by an appropriate value. The time to peak occurs at 5 * tc, while the time base is 10 * tc. All coefficients occur at increments of tc, and are different depending on whether tc is less than 20 minutes or not. The following table lists the coefficients and a typical hydrograph is shown below.
| |||
| t/tc | Q/Qp for tc < 20 min | Q/Qp for tc >= 20 min | |
|---|---|---|---|
| 0 | 0.00 | 0.00 | |
| 1 | 0.16 | 0.04 | |
| 2 | 0.19 | 0.08 | |
| 3 | 0.27 | 0.16 | |
| 4 | 0.34 | 0.32 | |
| 5 | 1.00 | 1.00 | |
| 6 | 0.45 | 0.30 | |
| 7 | 0.27 | 0.11 | |
| 8 | 0.19 | 0.05 | |
| 9 | 0.12 | 0.03 | |
| 10 | 0.00 | 0.00 | |
- where:
- tc = Time of concentration.
- Q = Flow at time t, in cfs.
- Qp = Peak flow.
Related Topics
WMS – Watershed Modeling System | ||
|---|---|---|
| Modules: | Terrain Data • Drainage • Map • Hydrologic Modeling • River • GIS • 2D Grid • 2D Scatter |  |
| Models: | CE-QUAL-W2 • GSSHA • HEC-1 • HEC-HMS • HEC-RAS • HSPF • MODRAT • NSS • OC Hydrograph • OC Rational • Rational • River Tools • Storm Drain • SMPDBK • SWMM • TR-20 • TR-55 | |
| Toolbars: | Modules • Macros • Units • Digitize • Static Tools • Dynamic Tools • Drawing • Get Data Tools | |
| Aquaveo | ||


