WMS:Rational Method Traditional vs Route by Summing
The main difference between these two methods is that the traditional method computes a peak flow at an outlet by determining composite C, tc, and areas from upstream basins and tributaries. Using the composite tc a rainfall intensity from an IDF curve is chosen to compute peak flow and then one of the hydrograph methods is used to develop a runoff hydrograph. The route by summing method, on the other hand, computes peak flows and hydrographs for basins in the traditional manner, but hydrographs at outlet points are determined by combining or summing the hydrographs from upstream basins and tributaries. The lag time determines the timing offset for hydrographs that “arrive” at an outlet through a tributary channel. With this method, there is also the option of defining a detention basin, through which the outlet hydrograph may be passed. The detention basin is defined and calculated using the same techniques as outlined in the hydrologic calculators (see Detention Basin Calculator).
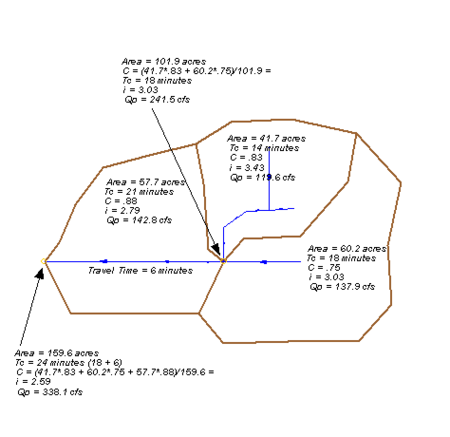
The differences can probably best be understood with the following example. The figure below shows a diagram of the basin containing two “upstream” basins that combine at a junction and are routed through a lower basin. The areas, runoff coefficients, times of concentration and lag times for each basin and for the outlets (using the traditional method) are as shown.
Rainfall intensities are determined using the times of concentration and an IDF curve. As would be expected the higher the time of concentration, the smaller the intensity.
Peak values for the three sub-basins are identical for each of the two methods. However, for the outlet points the peak flows (and therefore hydrographs) are different.
In the case of the traditional method the time of concentration for the “upstream” outlet (the location where the two upper basins join) is determined to be 18 minutes (the largest tc of the two basins). From this tc a rainfall intensity of 3.03 is determined from the IDF curve. The contributing area is 101.9 acres (the sum of the two upstream basins), which when using equation 13.1 results in a peak flow of 241.7 cfs.
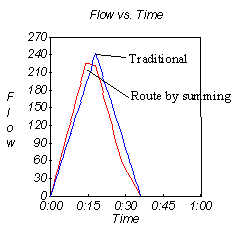
For the route by summing method the two upstream hydrographs are summed and the resulting peak flow value is determined. In our example the standard rational method (triangular shaped hydrograph) option was chosen. Since the times of concentration are different (and therefore the times to peak for the hydrographs) the resulting peak flow is not the sum of the two basin peak flows, but as can be seen in below, is 225 cfs.
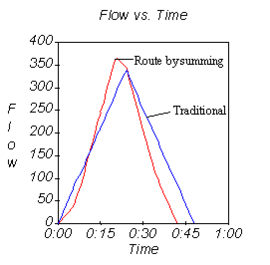
For the lower outlet point a similar comparison can be made. The only difference is that the time of concentration is the longest time between the time of concentration of the lower basin (21 minutes), and the longest time of concentration of the two upstream basins plus the travel time through the tributary (18 + 6 = 24 minutes). In this case it is 24 minutes. Using the traditional method the rainfall intensity for a time of concentration equal to 24 minutes is 2.59, the total summed area is 159.6 acres and the resulting peak flow 338.1 cfs. The peak flow for the route by summing methods is 366 cfs, and the comparison of hydrographs using the standard triangular rational method dimensionless unit hydrograph is shown below.
One final difference is that with the route by summing method the addition of reservoirs (detention basins) in the calculations is possible. However, with either method a resulting hydrograph could be used in the design of a detention basin as a separate operation.
Related Topics
WMS – Watershed Modeling System | ||
|---|---|---|
| Modules: | Terrain Data • Drainage • Map • Hydrologic Modeling • River • GIS • 2D Grid • 2D Scatter |  |
| Models: | CE-QUAL-W2 • GSSHA • HEC-1 • HEC-HMS • HEC-RAS • HSPF • MODRAT • NSS • OC Hydrograph • OC Rational • Rational • River Tools • Storm Drain • SMPDBK • SWMM • TR-20 • TR-55 | |
| Toolbars: | Modules • Macros • Units • Digitize • Static Tools • Dynamic Tools • Drawing • Get Data Tools | |
| Aquaveo | ||


