GMS:MODFLOW Display Options: Difference between revisions
From XMS Wiki
Jump to navigationJump to search
No edit summary |
No edit summary |
||
| (2 intermediate revisions by one other user not shown) | |||
| Line 1: | Line 1: | ||
{{MODFLOW Links}} | {{MODFLOW Links}} | ||
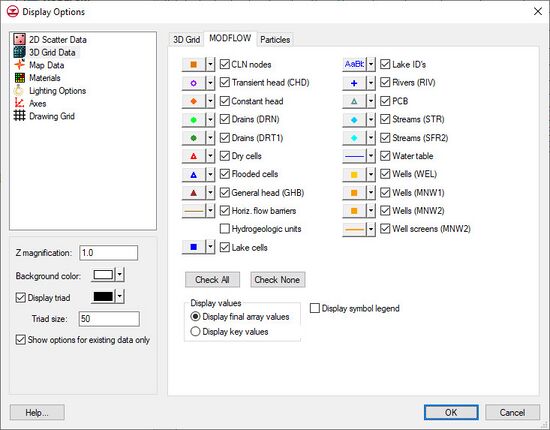
The properties of all MODFLOW data that GMS displays on the screen can be controlled through the MODFLOW tab of the ''Display Options'' dialog. This dialog is opened by right-clicking on the [[File:MODFLOW Folder.svg|16 px]] MODFLOW entry in the [[GMS:Project Explorer|Project Explorer]] and selecting the '''Display Options''' command. It can also be accessed | The properties of all MODFLOW data that GMS displays on the screen can be controlled through the MODFLOW tab of the ''Display Options'' dialog. This dialog is opened by right-clicking on the [[File:MODFLOW Folder.svg|16 px]] MODFLOW entry in the [[GMS:Project Explorer|Project Explorer]] and selecting the '''Display Options''' command. It can also be accessed from the ''Display'' menu, the ''MODFLOW'' menu, or the '''Display Options''' [[File:Display Options Macro.svg|16 px]] macro. The following table describes the display options available for MODFLOW models. | ||
{| class="wikitable" | {| class="wikitable" | ||
| Line 26: | Line 26: | ||
|- | |- | ||
| Check None ||Turns off all display options. | | Check None ||Turns off all display options. | ||
|- | |||
|Display Values || Option for either the key values or the final array values to be used for display.- | |Display Values || Option for either the [[GMS:Parameters#Key_Values|key values]] or the final array values to be used for display. For MODFLOW datasets that have both key values and array values defined, this option sets which values display in the ''Edit Dataset Values'' dialog. It also sets which values display in the Graphics Window when MODFLOW datasets with both kinds of values are the active dataset. This setting can also be adjusted using the right-click menu in the Project Explorer for MODFLOW datasets that have both types of values. This option has no effect for datasets that don't have both key values and array values | ||
*Display final array values – Displays array values associated with each cell. They represent the actual value for a specific input parameter. These may be values specified by the user or might be values calculated using MODFLOW. | |||
*Display key values – Displays the key values used for parameterization of the selected dataset. Only available if the [[GMS:Parameters#Key_Values|key values approach to parameterization]] is used. These values are used to define zones, but are not the actual value of a specific parameter. They are usually negative numbers that are not included in the actual dataset. | |||
|- | |- | ||
| Display symbol legend || If the ''Symbol legend'' option is selected, a legend showing each of the symbols associated with sources/sinks, dry cells, and flooded cells is displayed in the lower right corner of the GMS window. | | Display symbol legend || If the ''Symbol legend'' option is selected, a legend showing each of the symbols associated with sources/sinks, dry cells, and flooded cells is displayed in the lower right corner of the GMS window. | ||
