GMS:EVT Package: Difference between revisions
No edit summary |
|||
| Line 37: | Line 37: | ||
===2D Data Set -> Array=== | ===2D Data Set -> Array=== | ||
The 2D Data Set -> Array button brings up the Data Browser listing all of the current data sets associated with the current 2D grid. In order for this button to be active, the 2D grid must have the same number of rows and columns as the 3D grid. The selected data set is copied to the recharge array. Data sets are typically generated with the 2D Scatter Point module. The 2D Scatter Point module can be used to interpolate from a scattered set of rainfall measurements to the cell locations. If the data set is transient, the values in the data set are linearly interpolated, if necessary, to each stress period as the data set is copied to the array. | The '''2D Data Set -> Array''' button brings up the Data Browser listing all of the current data sets associated with the current 2D grid. In order for this button to be active, the 2D grid must have the same number of rows and columns as the 3D grid. The selected data set is copied to the recharge array. Data sets are typically generated with the 2D Scatter Point module. The 2D Scatter Point module can be used to interpolate from a scattered set of rainfall measurements to the cell locations. If the data set is transient, the values in the data set are linearly interpolated, if necessary, to each stress period as the data set is copied to the array. | ||
===Array -> 2D Data Set=== | ===Array -> 2D Data Set=== | ||
Revision as of 17:31, 14 May 2012
To learn more about Evapotranspiration in MODFLOW go here: http://water.usgs.gov/nrp/gwsoftware/modflow2000/ofr00-466.pdf
EVT Package Dialog
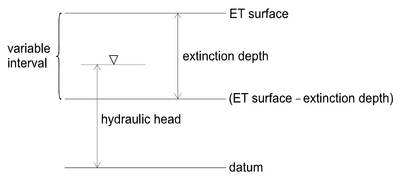
The dialog for editing the evapotranspiration package input data is identical to the Recharge Package dialog except that rather than editing the flux and layer indicator arrays, the evapotranspiration arrays are edited: elevation, ET extinction depth, maximum ET rate, and layer indicator.
Evapotranspiration Option
Two ET options are supported by MODFLOW: ET only at the top layer, and ET at specified vertical cells.
Multiplier
The multiplier is a constant which can be written to the package file with each stress period array. Each value in the array is scaled by the multiplier as the array is imported to MODFLOW. The format button brings up a dialog listing the standard MODFLOW formats. This format is used for displaying the values in the spreadsheet and it controls how the values are written to the package file.
Stress Periods
The values displayed in the spreadsheet are for an individual stress period. The values associated with other stress periods can be edited by entering the ID of the desired stress period in the Stress period edit box in the center of the dialog. If the Use previous option is selected for a given stress period, the values from the previous stress period are used and the spreadsheet is dimmed.
2D Data Set -> Array
The 2D Data Set -> Array button brings up the Data Browser listing all of the current data sets associated with the current 2D grid. In order for this button to be active, the 2D grid must have the same number of rows and columns as the 3D grid. The selected data set is copied to the recharge array. Data sets are typically generated with the 2D Scatter Point module. The 2D Scatter Point module can be used to interpolate from a scattered set of rainfall measurements to the cell locations. If the data set is transient, the values in the data set are linearly interpolated, if necessary, to each stress period as the data set is copied to the array.
Array -> 2D Data Set
The Array -> 2D Data Set button copies the array to the 2D data set list associated with the existing 2D grid.
Constant -> Array
The Constant -> Array button brings up a dialog which prompts for a single value. This constant is then assigned to each item in the array for the given stress period.
Spreadsheet
The spreadsheet allows you to edit a 2D array of values, the type depending on the selection in the view/edit combo box. The array types include elevation, et extinction depth, and max ET rate.
Notes
- ^ Banta, Edward R. (2000), MODFLOW-2000, The U.S. Geological Survey Modular Ground-Water Model-Documentation of Packages for Simulating Evapotranspiration with a Segmented Function (ETS1) and Drains with Return Flow (DRT1). Open-File Report 00-466., Denver, Colorado, http://water.usgs.gov/nrp/gwsoftware/modflow2000/ofr00-466.pdf
GMS – Groundwater Modeling System | ||
|---|---|---|
| Modules: | 2D Grid • 2D Mesh • 2D Scatter Point • 3D Grid • 3D Mesh • 3D Scatter Point • Boreholes • GIS • Map • Solid • TINs • UGrids | |
| Models: | FEFLOW • FEMWATER • HydroGeoSphere • MODAEM • MODFLOW • MODPATH • mod-PATH3DU • MT3DMS • MT3D-USGS • PEST • PHT3D • RT3D • SEAM3D • SEAWAT • SEEP2D • T-PROGS • ZONEBUDGET | |
| Aquaveo | ||
