| Display Option |
Description
|
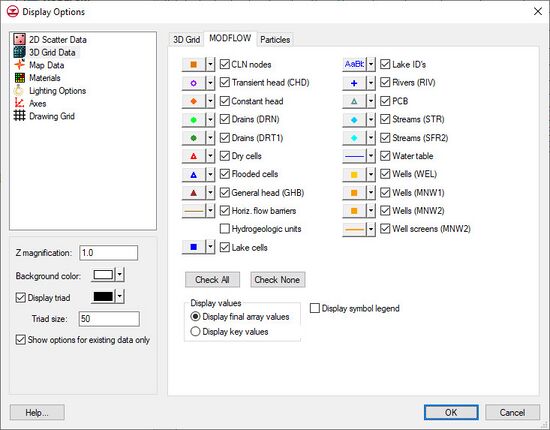
| Wells, Drains, Rivers, Streams, General head, Constant head, Transient head, CLN nodes |
These items represent source/sink objects. If the checkbox to the left of each source/sink name is selected, a symbol is displayed at the center of each cell with that type of source/sink. The symbol for each source/sink is displayed to the left of the checkbox. The symbol can be changed by selecting the symbol button. This brings up the symbol editor dialog. The symbol editor contains a list of available symbols. The dialog can also be used to edit the size and color of the symbol.
|
| Dry cells |
Displays a symbol at the location of all dry cells in the grid. A MODFLOW solution must be imported to GMS prior to displaying dry cells. When a cell goes dry during a MODFLOW simulation, the HDRY value defined in the BCF Package is assigned as the head value for the cell. If an HDRY value is encountered in the active scalar dataset when the display is refreshed, the cell is assumed to be dry.
|
| Flooded cells |
The computed water table elevation often exceeds the elevation of the ground surface. The Flooded cells option is used to draw a symbol at the center of all cells where the computed water table elevation is greater than the top elevation of the top layer in the grid.
|
| Horiz. flow barrier |
Displays a line at the location of each horizontal barrier. The attributes (thickness, color, etc.) can be edited by clicking on the small window to the left of the Horiz. flow barrier checkbox.
|
| Display hydrogeologic units |
The Display hydrogeologic units option is used to display HUF data. This option only works if the current display mode is Ortho Mode. This mode can be turned on in the Display menu.
|
| Lake cells |
Draws a symbol in the center of each cell representing a lake. The symbol, the symbol size, and symbol color can be adjusted by clicking on the button to the left of the Lake cells checkbox.
|
| Lake ID's |
Displays the lake ID in the center of each cell representing a lake. The font, font size, and font color can be adjusted by clicking on the button to the left of the lake ID's checkbox.
|
| PCB |
Displays a symbol in the center of each cell that has a prescribed or constant concentration boundary. The symbol, the symbol size, and symbol color can be adjusted by clicking on the button to the left of the Lake cells checkbox.
|
| Water table |
When a grid cross section is displayed in orthogonal mode, this tool superimposes the water table defined by a MODFLOW solution on the layer geometry. The water table is defined as the head value in the uppermost active cell. If the water table display is on, all contours (head, concentration, etc.) are clipped so that they lie at or below the water table. This option is only available if the True Layer display option is active under the 3D Grid display options tab.
|
| Check All |
Turns on all display options.
|
| Check None |
Turns off all display options.
|
| Display symbol legend |
If the Symbol legend option is selected, a legend showing each of the symbols associated with sources/sinks, dry cells, and flooded cells is displayed in the lower right corner of the GMS window.
|
