WMS:DEM Guidelines: Difference between revisions
No edit summary |
|||
| Line 65: | Line 65: | ||
{{WMSMain}} | {{WMSMain}} | ||
[[Category:DEM|G]] | |||
Revision as of 15:24, 18 February 2014
A digital elevation model (DEM, as defined in WMS) is simply a two-dimensional array of elevation points with a constant x and y spacing. While a DEM results in data redundancy for surface definition, its simple data structure and wide-spread availability have made them a popular source for digital terrain modeling and watershed characterization. Several researchers, including Puecker and Douglas (1975) and Garbrecht and Martz (1995) have developed methods to extract watershed geomorphology from DEMs. WMS includes many of these same tools.
The most common form of DEM elevations are the USGS digital maps. DEMs can be downloaded free of charge from the EROS home page at http://edcwww.cr.usgs.gov/doc/edchome/ndcdb/ndcdb.html. Other sources of elevation data may include federal, state, and local government agencies, universities, or private data publishers. WMS can read digital elevation in standard USGS (the older single file format or the new SDTS formatted files), ARC/INFO®/ArcView® ASCII grid, DTED, and GRASS grid formats. Flow directions and flow accumulations for DEM points are computed using TOPAZ (Compute TOPAZ Flow Data command in the Drainage menu). This program uses an eight point pour technique to determine the direction of flow. This technique specifies that the flow will be directed toward the neighboring (in a structured grid there are eight neighbors for each point) DEM point with the lowest elevation. The algorithms typically include functionality for eliminating pits and resolving ambiguities when the lowest elevation is shared by more than one neighboring point.
DEMs can be used to delineate watershed and sub-basin boundaries which can subsequently be converted to a series of arcs and polygons. DEMs can also be converted to TINs and used to develop hydraulic models. Additionally, DEMs can be contoured and displayed in oblique view. When creating a TIN, they can be used as a background elevation map.
The typical steps for using DEMs to develop hydrologic models are:
1. Obtain and Import a Digital Elevation Model (DEM)
As mentioned above, USGS DEMs can be downloaded from the Internet or obtained from government agencies, universities, or private vendors. The File | Open command can be used to import the DEM from one of the supported formats. The figure below shows a contoured DEM after it has been imported.
2. Compute Flow Directions and Flow Accumulations
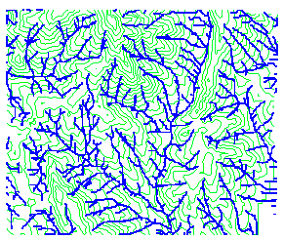
Flow directions are computed from the active DEM region using a custom version of the TOPAZ model distributed with WMS. Once flow directions are assigned for each DEM point, TOPAZ then computes flow accumulations at each DEM point as well. The flow accumulation for a given DEM point is defined as the number of DEM points whose flow paths eventually pass through that point. For example, DEM points that are part of a stream have high flow accumulation values since the flow paths of all "upstream" points will pass through them. Streams are easily identified by displaying all DEM points with a flow accumulation value greater than a user-defined threshold as shown below. Flow accumulations can be computed in WMS from the flow directions, or read from ARC/INFO®, GRASS, or TOPAZ formatted files.
3. Identify the Watershed Outlet and Convert DEM Streams to Arcs
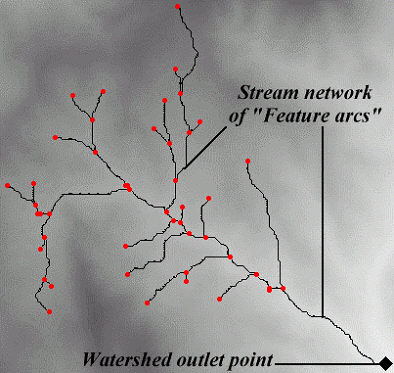
With the aid of the flow accumulations, the location of the watershed outlet needs to be determined and an outlet feature point created there. A minimum threshold is then defined and all of the DEM points “upstream” from the defined outlet(s) are connected together to form a stream network of feature arcs.
You should note that the stream feature arcs can be created in any fashion. For example, in an urban area the streams will not likely be well-defined from the DEM elevations and flow directions. The flow directions for the DEM are then used for basic overland flow whereas the stream vectors are used for conveyance channels. Practically, you can think of WMS modifying the flow directions of the DEM points underlying the stream vectors so that flow always follows the defined stream vectors.
4. Define Interior Sub-basin Outlet Points
If you wish to further subdivide the watershed into sub-basins then nodes along the stream feature arcs should be converted to "outlet" nodes by using the feature point/node attributes dialog. As these nodes are converted the hydrologic modeling tree is automatically updated.
5. Define Basins
Using the outlets on the stream network and the flow directions, the contributing DEM points for each outlet are assigned the proper basin ID.
6. Convert DEM Basins to Polygons
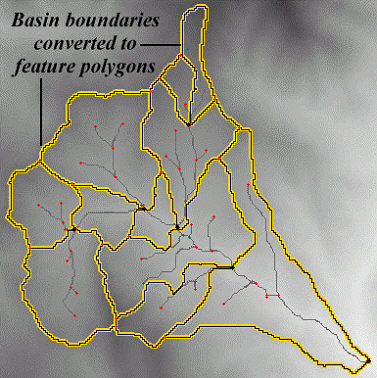
Similar to how flow accumulations were converted to stream arcs, the boundaries between DEM points with different basin IDs can be converted to feature polygons. Storing a basin as a single polygon rather than several hundreds (or thousands) of DEM cells is much more efficient.
7. Compute Basin Geometric Data
Once the boundaries of the sub-basins have been determined geometric properties important to hydrologic modeling (area, slopes, runoff distances, etc.) can be computed from the DEM data.
8. Define the Hydrologic Model
At this point you will have the same model as described in the previous section, where watersheds are defined strictly from the feature points, lines (arcs), and polygons. The computed data from step nine is automatically stored in the appropriate locations for hydrologic model definition, and the remaining parameters for the desired hydrologic model can be entered using the appropriate interface dialogs.
Related Topics
WMS – Watershed Modeling System | ||
|---|---|---|
| Modules: | Terrain Data • Drainage • Map • Hydrologic Modeling • River • GIS • 2D Grid • 2D Scatter |  |
| Models: | CE-QUAL-W2 • GSSHA • HEC-1 • HEC-HMS • HEC-RAS • HSPF • MODRAT • NSS • OC Hydrograph • OC Rational • Rational • River Tools • Storm Drain • SMPDBK • SWMM • TR-20 • TR-55 | |
| Toolbars: | Modules • Macros • Units • Digitize • Static Tools • Dynamic Tools • Drawing • Get Data Tools | |
| Aquaveo | ||


