WMS:Flood Extent
A flood extent coverage is created from a flood delineation dataset and contains polygons showing inundated limits or differences in inundation limits between two different floodplain delineation scenarios. Three different types of flood extent coverages can be created: Flood Depth Maps, Impact Maps, and Extent Maps.
Flood Depth Map
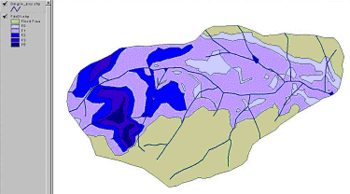
The classified flood depth coverage (Conversion | Flood→Depth Map command in the Flood menu) shows the variation of flood using different classes. Each class represents a range of flood depths (or water surface elevations) specified. On the other hand the flood extent coverage contains the land-water boundary showing the extent of a floodplain. These coverages can be exported from WMS for reporting or use with Geographic Information Systems (GIS) to perform other flood management tasks.
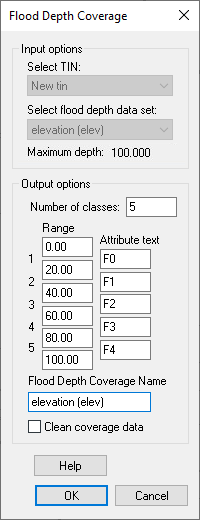
The Flood Depth Coverage dialog shown below allows specifying the options for creating the depth map.

First select the TIN (if more than one TIN is present) and the dataset to create the coverage for (this would typically be a water surface or flood depth dataset computed from the flood delineation process, but note that the elevation dataset may be used as well). The first range will be from 0.0 to the value specified and the second range from the values between 1 and 2. The attribute field can be used to store a keyword or text that will be exported as an attribute of a shape file when exported and should be something that uniquely identifies the given range.
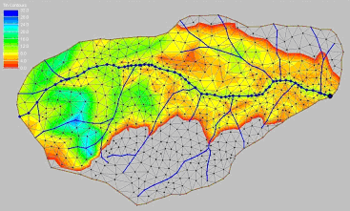
An example of a flood depth map is shown below:
 |
 |
Flood Impact Map
The floodplain delineation tools allow comparing two different flooding scenarios and generate a flood impact coverage. A flood impact coverage shows increase and decrease in flooding from two different delineations using different classifications. Like other coverages, this can also be exported from WMS for reporting or other flood management purposes.
An impact map is created (Conversion | Flood→Impact Map command in the Flood menu) by showing classified increases and decreases between two separate delineations. It is possible to specify what the change increments are for increased and decreased (up to 5 each) flooding between two calculated datasets. A coverage of polygons is then generated for each classification. A keyword or text string can be stored with each polygon classification in order to better identify it when exported to a shape file for use in Geographic Information Systems (GIS) analysis.
Flood Extent Map
The Conversion | Flood→Extent Coverage command in the Flood menu allows creating a polygon in a flood extent coverage that defines the inundated area as determined in the flood depth dataset. The default inundation limit is 0.0, but any positive depth value can be specified as the inundation limit and WMS will generate a polygon that conforms to that limit.
To create the flood extent map aspecify the flood depth and water surface elevation datasets along with the inundation limit. Optionally, have WMS force or stamp in the flood extent coverage to the TIN. This will insure that there are TIN vertices with depth values at exactly 0.0. This is not the case in the original data sets computed by the floodplain delineation algorithm. The 0.0 (or any other depth contour value) value is likely interpolated along a triangle edge between two vertices. Stamping the flood extent coverage into the TIN is particularly useful for confining the display of water surface elevation values to be within the flood extent region. While the inundation limit for flood depth is a constant value (0.0), the value of water surface elevation at the inundation limit is not. By stamping in the flood extent coverage and updating the associated data sets water surface elevation contours can be controlled since WMS will set vertices outside of the flood extent coverage to be inactive and those inside to be active.
Related Topics
| [hide] WMS – Watershed Modeling System | ||
|---|---|---|
| Modules: | Terrain Data • Drainage • Map • Hydrologic Modeling • River • GIS • 2D Grid • 2D Scatter |  |
| Models: | CE-QUAL-W2 • GSSHA • HEC-1 • HEC-HMS • HEC-RAS • HSPF • MODRAT • NSS • OC Hydrograph • OC Rational • Rational • River Tools • Storm Drain • SMPDBK • SWMM • TR-20 • TR-55 | |
| Toolbars: | Modules • Macros • Units • Digitize • Static Tools • Dynamic Tools • Drawing • Get Data Tools | |
| Aquaveo | ||